Working out relationships
You are in an archived section of the AIFS website
Download Research report
Overview
Young people today, especially young women, have far greater opportunities than earlier generations to continue their education well beyond school-leaving age, pursue careers, and travel to numerous countries. Despite all such opportunities open to them, forming stable, nurturing relationships in early adulthood, and having and raising children in a happy, stable family setting are still important aspirations held by most young people (Qu & Soriano, 2004; Smart, 2002).
However, trends in the formation and stability of relationships and in childbearing and family formation have changed in striking ways over past decades. This is to be expected, as "change is a constant", reflecting ways in which we respond to economic and social pressures and opportunities that arise within and beyond our families. In turn, these responses themselves, regardless of their level of diversity, represent societal trends that affect the economic and social pressures and opportunities for families, including those linked with changing social values and social norms. The monitoring of all such trends is important for informing policy decision-making, including program design and service delivery.
This facts sheet focuses on partnership and fertility trends, with a view to feeding into such decision-making.1 That said, future changes could occur in unexpected ways (Cherlin, 2004; McDonald & Kippen, 1999, 2011). Such "lessons of history" highlight the fact that we have always been in an "age of uncertainty".2
Forming relationships
In keeping with the aspirations of most young people today, the initial set of data presented here focuses on registered marriage (here called "marriage") - trends in the number of marriages taking place, crude marriage rates, and median age at first marriage. This is followed by a discussion of trends in cohabitation (i.e., relationships where partners are living together in a sexual union without being in a registered marriage).
Trends in registered marriages
Figure 1 depicts the number of marriages that took place in Australia across the years from 1901 to 2011, and associated crude marriage rates; that is, the number of marriages that occurred for every 1,000 members of the resident population in any given year.
Figure 1: Number of marriages and crude marriage rate, 1901-2011
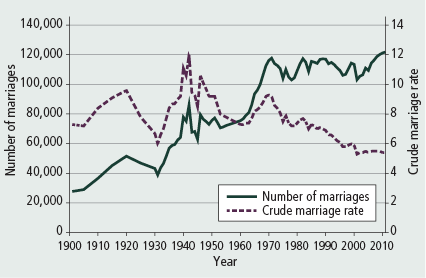
Note: Crude marriage rate is the number of marriages per 1,000 of the resident population in a given year.
Source: ABS. (various years). Marriages and divorces Australia
Given the increasing size of Australia's population, it is hardly surprising that the absolute number of marriages taking place annually has increased significantly. While the trend has been mostly linear, localised "peaks" and "troughs" have occurred, coinciding with those apparent in the crude marriage rate. However, the crude marriage rate has fluctuated greatly over the years, and in recent years has been the lowest on record. This, too, is not surprising, for though the absolute number of marriages has increased by over four times (from 27,750 in 1901 to 121,750 in 2011), the population has increased by nearly six times (from 3.77 million to 21.5 million).
Marriage rates have fallen during recessions, and increased during wars and their aftermath (Hugo, 2001). In the first few years of the 20th century, when Australia was still recovering from the economic recession of the 1890s, the crude marriage rate was low relative to most years covering the first half of the century. The rate was also affected by the prevailing gender imbalance (110 men aged 20-59 years for every 100 same-aged women, compared with 103:100 some 20 years later),3 and by the fact that couples were encouraged to postpone marriage until they could achieve a standard of living considered to be "respectable" at the time (McDonald, 1995).
Further declines following upswings occurred during the fast-paced "Roaring Twenties", the early 1930s (when the country was in the grip of the Great Depression and many marriages were postponed), and in the last few years of World War II. The longest period of decline, however, covers the most recent forty years.
Sharp increases tended to immediately follow sharp dips, as previously postponed marriages took place along with others that would have occurred anyway. However, some people who were at the normative marriage age at the time of these dips would have remained single thereafter, for postponement of life course transitions limits opportunities for their future occurrence.
The highest crude marriage rates (10.6-12.0) occurred in 1940-42 when the prospect of military service may have sparked hasty marriages, and again directly after World War II in 1946-48 (9.7-10.6). The rate increased again in the 1960s due to continued economic prosperity, the fall in age at first marriage, continuing strong social disapproval of sexual relationships outside marriage; and the introduction of the oral contraceptive pill.
The crude marriage rate has mostly fallen from 1972 onwards, with the lowest rate (5.3) occurring in 2001. Since this time, the rate has fluctuated between 5.4 and 5.5.
Interestingly, these recent rates are lower than the rate apparent in 1931 (6.0); that is, during the Great Depression. The 1931 rate represented the all-time low until 1996, when it reached 5.8. As will be seen below, the most recent fall in the crude marriage rate has been accompanied by increases in cohabitation (and, most probably, increasing willingness to disclose this relationship status in Census forms), and age at first marriage.
Trends in age at first marriage
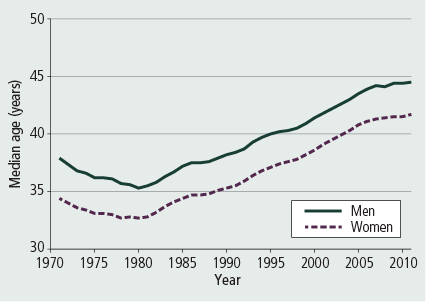
Age at marriage is one of the many factors affecting the crude marriage rate. Figure 2 shows the median age of men and women at first marriage, from 1940 to 2011.
Figure 2: Median age of men and women at first marriage, 1940-2011
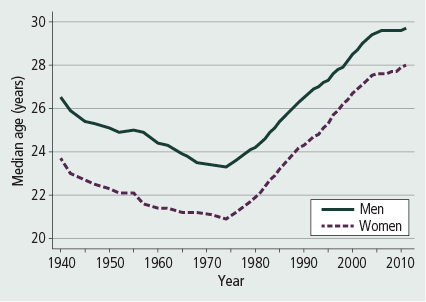
Sources: ABS. (various years). Marriages and divorces Australia; ABS (1997); ABS unpublished data
While the crude rate has fluctuated considerably, the median age at marriage fell until the mid-1970s then increased more or less progressively, though at a slower rate in recent years. In addition, the gender gap in the median marriage age has narrowed:
- Between 1940 and 1974, men's median age at first marriage fell by more than three years (from 26.5 years to 23.3 years), then returned to 26.5 years by 1990 and continued to increase, stabilising at 29.6 between 2006 and 2010, before increasing marginally (to 29.7) in 2011.
- The median age that women entered their first marriage also fell by more than two years between 1940 and 1974 (from 23.7 years to 20.9 years), but then increased to 27.6 by 2005, reaching 28.0 in 2011.
- The gender gap in median age at first marriage was greatest in the late 1950s (3.3 years in 1957), and has gradually narrowed since this period, with the narrowest gap occurring in the two most recent years recorded (1.7 years in 2010 and 2011).
The three decades immediately following World War II were therefore most unusual in terms of age at first marriage, but today's trends are also unusual: men and women today are taking a longer time to enter their first marriage than has been the case since at least 1940.
The modern trends can be explained by increased demands for a skilled workforce, beginning during the 1980s and 1990s, which have led young people to remain in education and live in the parental home for longer. The introduction of the contraceptive pill, which initially encouraged people to marry early (when social condemnation of sexual relationships outside marriage was very strong), eventually led to an increase in cohabitation and an associated weakening of the social stigma attached to this lifestyle (Carmichael, 1984, 1995). This also is associated with a fall in the number of "shot-gun marriages", which entail the marriage of pregnant women to avoid having a child out of wedlock (McDonald, 1995).4
Rise in cohabitation
While most people marry at some stage, pathways to union formation have changed dramatically. For most of the 20th century, almost all couples married then moved in together, whereas the reverse is true today: most couples who marry have already been living with each other for some time. However, as will be seen later in this facts sheet, cohabitation is not necessarily a prelude to marriage. Given the rise in cohabitation, marriage rates are no longer a reasonable proxy for rates of union formation.
Figure 3 focuses on marriages that took place across various years from 1975 to 2011, and shows the proportion of marriages that were apparently preceded by cohabitation. This proportion increased at a more or less steady rate between 1975, when only 16% of couples who married had been cohabiting, and 2000, when 71% had been cohabiting.
Figure 3: Proportion of marriages preceded by cohabitation, 1975-2011
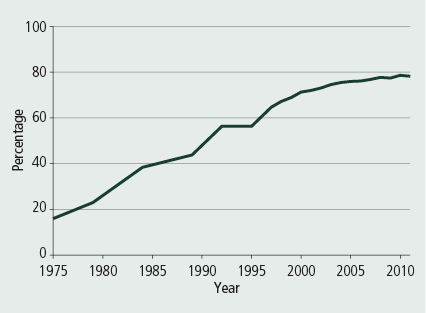
Source: ABS. (various years). Marriages and divorces Australia
The adoption of this pathway increased further over the next 10 years, albeit at a slower rate, peaking at 79% of all marriages in 2010. In 2011, 78% of marriages were preceded by cohabitation.
Prevalence of cohabiting and married unions
While the rates of living together without marrying are increasing, cohabitation is nevertheless the normative pathway to marriage.5 It remains the case that the vast majority of couples in a living-together union are married to each other, applying to more than 99% in 1971. Nevertheless, cohabitation without marriage appears to have increased by one to three percentage points across each Census year since that time, reaching 16% in 2011.6 The level of increase since the 1970s is likely to be exaggerated somewhat, given that disclosures of cohabiting arrangements most probably increased as the social stigma attached to this arrangement weakened (for a discussion on changing attitudes to cohabitation and marriage, see Qu & Weston, 2008a).
The likelihood of being in a cohabiting relationship rather than being married varies with age in understandable ways. Figures 4 and 5 show the proportions of partnered men and women who were cohabiting rather than married across the 15-year period from 1996 to 2011 (based on Census years).
Figure 4: Proportion of partnered men who were in a cohabiting relationship, 1996-2011
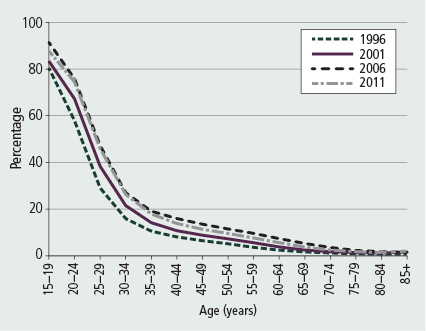
Notes: Excludes persons who were "Visitors only"; in "Other non-classifiable" households, "Non-private dwellings", and "Migratory, off-shore and shipping" SA1s; and were temporarily absent on Census night. Includes same-sex couples.
Sources: ABS (2007, 2012b)
Figure 5: Proportion of partnered women who were in a cohabiting relationship, 1996-2011
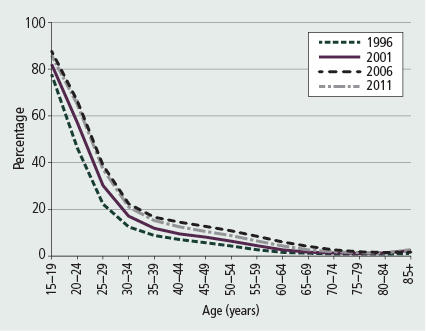
Notes: Excludes persons who were "Visitors only"; in "Other non-classifiable" households, "Non-private dwellings", and "Migratory, off-shore and shipping" SA1s; and were temporarily absent on Census night. Includes same-sex couples.
Sources: ABS (2007, 2012b)
Cohabitation applies to most partners who are teenagers or in their early 20s (especially the former). In 2011, cohabitation applied to:
- 91% of partnered male teenagers and 76% of men in their early 20s (up from 80% and 58% respectively in 1996); and
- 88% of partnered female teenagers and 66% of women aged 20-24 years (up from 78% and 46% respectively in 1996).
Partnered men and women in their late 20s and older were more likely to be married than cohabiting in 2011, although the difference for men in their late 20s was only marginal. The difference widens in favour of marriage as age increases.
The following proportions of partnered men were in a cohabiting relationship in 2011:
- 47% who were their late 20s (up from 29% in 1996);
- 27% of those in their early 30s (up from 16% in 1996); and
- 19% of those in their late 30s (up from 11% in 1996).
For partnered women in 2011, the following proportions were cohabitating:
- 39% of those who were their late 20s (up from 22% in 1996),
- 22% of those in their early 30s (up from 13% in 1996), and
- 17% of those in their late 30s (up from 9% in 1996).
Across all ages (except for women aged 85 years or more), the proportions of partnered individuals who were cohabiting rather than married increased over the years, with the greatest increases apparent among those in their early and late 20s. However, the rate of increase, especially for teenagers and young adults, has slowed recently. For example, the difference in cohabitation rates of partnered women in their late 20s was:
- 8.0 percentage points between 1996 and 2001;
- 7.1 percentage points between 2001 and 2006; and
- only 1.6 percentage points between 2006 and 2011.
Men in all age groups under 80 years old were more likely than women of the same age to be cohabiting. This simply reflects the fact that cohabitation is especially likely to occur in the early stages of a heterosexual union, with men entering the relationship at a slightly older age than their female partner.
Dissolving relationships
While the absolute number of marriages has generally increased across the years, and the crude marriage rate has fluctuated but is lower today than at any other time in recorded history, the picture concerning divorce numbers and crude rates tell a very different story. While marriage trends and factors contributing to them play a role in shaping divorce trends (for marriage is a prerequisite for divorce), divorce trends have also been heavily influenced by changing social norms about remaining in unhappy marriages, and associated legislative reforms (see Carmichael & McDonald, 1987; Finlay, 2005; Nicholson & Harrison, 2000; Parker, Parkinson, & Behrens, 1999).
Trends in divorce
Figure 6 depicts the number of divorces since 1901 and the corresponding crude divorce rate (i.e., the number of divorces granted in a year per 1,000 residents).
Figure 6: Number of divorces and crude divorce rate, 1901-2011
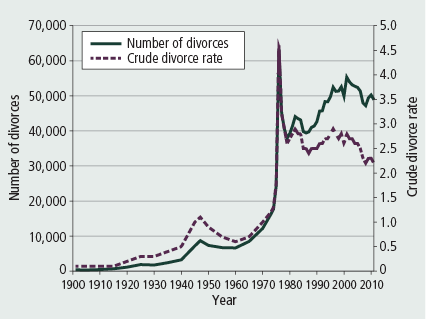
Note: Crude divorce rate is the number of divorces per 1,000 of the resident population in a given year.
Source: ABS. (various years). Marriages and divorces Australia
Prior to World War II, divorce was rare. In the first decade of the 20th century, the number of divorces recorded each year ranged from 300 to 500.
The crude divorce rate rose slightly in the 1920s to mid-1940s. It hit a peak in 1947, partly reflecting the instability of hasty wartime marriages and the disruptive effects of the war on marriage (Carmichael & McDonald, 1987; Coughlan, 1957).
The rate then declined slightly until the 1960s, when it changed direction again. The rise followed the introduction of the Matrimonial Causes Act 1959, which came into operation in 1961. The Act established uniform legislation across all Australian states and territories and provided 14 grounds for divorce, with people having to either prove fault or undergo five years of separation.
In response to increasing social pressure, the Federal Government, after much debate, introduced the Family Law Act 1975, which came into operation in January 1976. The crude divorce rate soared to its highest peak of 4.6 divorces per 1,000 resident population in that year, reflecting the formalisation of some long-term separations and the bringing forward of some divorces that had been filed in the previous years but had not yet been finalised. The highest number of divorces was also recorded in that year (63,230).
Since then, the crude divorce rate has mostly fluctuated between 2.5 and 2.9, with a trough occurring in the mid-1980s. However, the rate has fallen in the most recent decade (from 2.8 in in 2001 to 2.2-2.3 between 2007 and 2011).7
Unlike the crude divorce rate, the number of divorces mostly increased between the mid-1980s and the start of the new millennium - a trend that reflects the growth in the Australian adult population. Nevertheless, the number of divorces fell from 55,330 in 2001 to 47,209 in 2008.8
A more detailed picture of the patterns of divorce is obtained by determining the rates of divorce for specific age groups. These data for 2011 are presented in Figure 7. They show that:
- For women, the divorce rate was highest for the under-25 age group, whereas for men, it was highest for those aged 25-29 years - a gender difference that reflects the fact that women tend to marry at a younger age than men.
- Divorce was experienced by 18.2 in every 1,000 married men aged 25-29, and by 17.6 and 16.5 in every 1,000 married men aged under 25 years and 30-34 years respectively
- The number of women experiencing divorce in every 1,000 married women of the same ages was 20.8 at under 25 years, 18.8 at 25-29 years, and 16.9 at 30-34 years.
- The divorce rate was similar for those aged in their 30s and early 40s, and also for men and women in these age groups (men: 16.5-17.4; women 16.9-17.0).
- Beyond the early 40s, the rate declined progressively with increasing age; however, gender differences started to emerge again, with higher rates for men than women in the 50+ age categories. At least two factors contribute to this gender difference: the greater tendency for men than women of this age to re-marry (ABS, 2001b), and the greater instability of re-marriages than first marriages (see Coleman, Ganong, & Fine, 2000).9
Figure 7: Age-specific divorce rates, married men and women, 2011
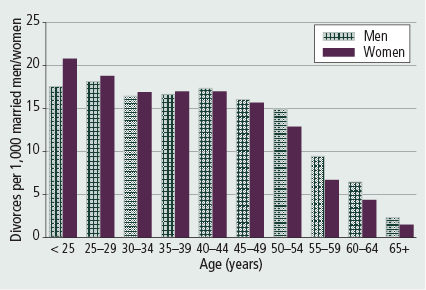
Source: ABS (2012d)
Change in the length of marriage
Figure 8 provides insight into the extent of change in the prevalence of both fairly short and lengthy marriages among the divorcing population. It shows the proportions of all divorces granted in various years (from 1980 to 2011) to couples who had (a) separated after fewer than 10 years of marriage; (b) separated after at least 20 years of marriage; (c) divorced after fewer than 10 years of marriage; and (d) divorced after at least 20 years of marriage. The proportions changed little across the three years: 1980, 1985 and 1990.
Figure 8: Proportions of divorces where marriages had lasted fewer than 10 years or at least 20 years, 1980-2011
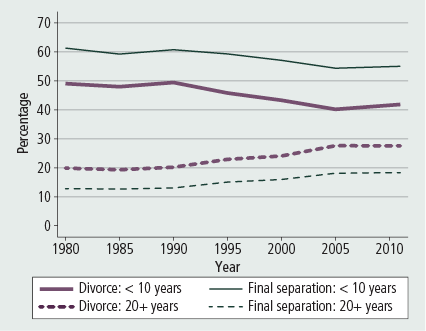
Source: ABS (2012d)
The proportion of all divorces that have occurred to couples who have been married for a long period has increased in recent decades. In 1980 and 1990, 13% of couples whose marriages ended in divorce had separated after 20 or more years of marriage. This proportion increased to 15% in 1995, and was 18% in 2011. If the duration of marriage is taken to cover the period of marriage to the granting of divorce (rather than final separation), then the proportion of divorces involving at least 20 years of marriage increased from 20% in 1980 to 23% in 1995 and was 28% in 2011.
Of all divorcing couples, the proportion who finally separated after having been married for fewer than 10 years fell from 61% in 1980 to 54% in 2005 and 2006, and was 55% in 2011. The proportion who received their divorce after fewer than 10 years of marriage was 49% in 1980 and1990, compared with 40% in 2005. In 2011, the proportion was 42%.
For ease of interpreting Figure 8, the proportion of all marriages ending in divorce that lasted for 10-19 years (here called "medium-term marriages") are not depicted. In fact, little change occurred in the proportion of divorces that occurred after this length of marriage. For 26-28% of all divorces across the years examined, the duration of marriage to final separation was 10-19 years (representing 26% in 1980 and 27% in 2011), while 30-33% of all divorces took place after 10-19 years of marriage (representing 31% in both 1980 and 2011).
In short, among the divorcing population, the decline in shorter term marriages has been associated with an increase in longer term but not medium-term marriages. Nevertheless, of the three durations of marriage examined, divorces occurring after fewer than 10 years of marriage remain the most common.
Median age of divorce
As shown in Figure 9, the median age at divorce for men and women declined from at least the early 1970s to the early 1980s, and then increased, leveling out since the mid-2000s.
Figure 9: Median age at divorce, men and women, 1971-2011
Source: ABS (2012d)
The median age at divorce in 1971 was 38 years for men and 34 years for women and fell to 35 years and 33 years respectively by 1980. By 1990, the median age had increased to 38 and 35 years respectively for men and women. In 2011, the median age at divorce was 45 years for men and 42 years for women.
These trends are not surprising, given that the age at first marriage increased for both men and women from the mid-1970s until the new millennium (as discussed above). The pattern concerning age at divorce resembles that of age at first marriage, with the trough for age at divorce lagging by a few years. The increasing proportion of divorces involving longer term marriages is also likely to have contributed to increasing age at divorce for both men and women.
Divorces of couples with children
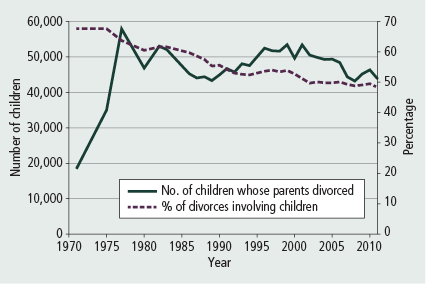
Although many divorces occur to couples with children under 18 years old, Figure 10 suggests that the proportion of all divorces that involve children has declined since the early 1970s - from 68% in 1971 to 61% in 1980, 56% in 1990, 53% in 2000, and 48% in 2011.
Figure 10: Proportion of divorces involving children under age 18 years, 1971-2011
Sources: ABS. (various years). Marriages and divorces Australia
In the last decade, around 47,000 to 55,000 children under 18 years experienced the divorce of their parents each year. Such trends may be partly explained by fertility trends and the duration of marriages that end in divorce. As will be seen below, couples are starting families later in life. Although they are also marrying later in life, reliable contraception has enabled the decoupling of marriage and childbearing. This has increased the chance of some couples divorcing before any plans they may hold for having children are achieved. In addition, the increased proportion of all divorces that entail longer term marriages suggests that increasing numbers of parents will divorce when all their children are at least 18 years old.
Separation of cohabiting couples
The trends in divorce discussed above do not capture the extent to which cohabiting relationships break down. Analysis of data from Growing Up in Australia: The Longitudinal Study of Australian Children (LSAC), indicates that children living with cohabiting parents are more likely than those living with married parents to experience parental separation.
Of infants who were living with two natural married parents in 2004, 12% were living with one natural parent by 2010. In contrast, among infants who were living with two natural parents in a cohabiting relationship in 2004, 27% were living with one natural parent by 2010. This pattern is consistent with prior research findings that cohabiting relationships are more likely than married relationships to separate (e.g., Qu & Weston, 2008b).
Living with a partner
Together, trends in couple formation and relationship breakdown shape the overall proportions of men and women who are partnered or unpartnered. Figures 11 and 12, which are based on analyses of Census data, show the proportions of men and women of different ages who were living with a partner in 1996, 2001, 2006 and 2011. These data focus exclusively on those who were known to be in private dwellings, and omits visitors to Australia.
Figure 11: Proportion of men in private dwellings who were living with a partner, 1996–2011
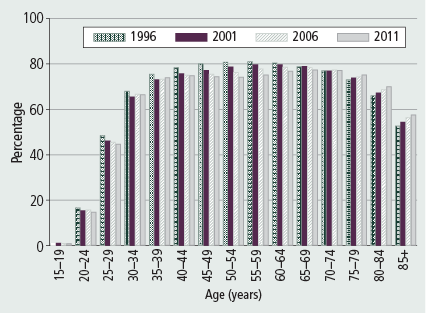
Note: Excludes persons classified as “Visitors only” and those who were in “Other non-classifiable” households, “Non-private dwellings”, and “Migratory, off-shore and shipping”.
Sources: ABS 1996–2011 Censuses
Figure 12: Proportion of women in private dwellings who were living with a partner, 1996–2011
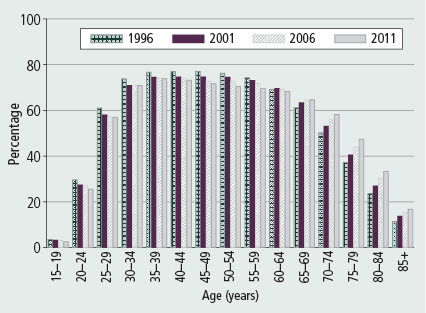
Note: Excludes persons classified as “Visitors only” and those who were in “Other non-classifiable” households, “Non-private dwellings”, and “Migratory, off-shore and shipping”.
Sources: ABS 1996–2011 Censuses
Partnership rates have fallen for several age groups since 1996. In other words, increases in cohabitation rates for these age groups were not large enough to compensate for the combined effects of decreases in marriage rates and the fragility of relationships.
These trends were most apparent for:
- men aged in their early 20s through to their early 60s; and
- women from their early 20s to their late 50s.
Among the younger age groups, the fall largely or entirely occurred between 1996 and 2001.
On the other hand, the fall was progressive across the Census years, particularly for:
- men aged in their late 40s through to their early 60s; and
- women in their early 40s through to their late 50s.
In contrast to these trends, partnership rates increased progressively for:
- the oldest three groups of men (from those aged in their late 70s on); and
- the oldest five groups of women (from those aged in their late 60s on).
Across all Census years, more than half the men aged 30-34 years and older were living with a partner. This applied to women aged 25-29 years through to 70-74 years.
Given that women are usually younger than men when they first cohabit or marry, partnership rates are considerably higher at younger ages for women than men. Thus, from the teenage years through to 30-39 years, women are more likely to be living with a partner than men. However, from age 40-44 years, men are more likely than women to be living with a partner.
Given that women tend to live longer than men, and are less likely than men to re-partner, the gender difference in partnership rates, at age 40-44 years onwards, increases, with the gap being especially marked for those aged in their 70s and older.
Despite being relatively large, the gender difference in the partnership rates of the older groups narrowed, and was most marked for those in their 70s and early 80s. For example, the following proportions of men and women aged in their late 70s were living with a partner:
- 73% of men and 37% of women in 1996 (a difference of 36 percentage points)
- 75% of men and 48% of women in 2011 (a difference of 27 percentage points)
The narrowing of the difference in partnership rates of these older people at least partly reflects a narrowing of the gap in the life expectancies of men and women, coupled with the fact that older people in 1996 were more likely to have married and less likely to have divorced than has been the case for more recent cohorts.10
Having children
Although it is by no means a universal transition, becoming a parent is clearly one of the most, if not the most, "life-changing" of all the events that are likely to occur in the course of people's lives. This section examines the extent of change in the timing of this transition for women, fertility rate trends and the proportions of babies born outside of marriage, including the proportions born to unpartnered women.
Becoming parents
Figure 13 shows the age distribution of new mothers in 1921, 1971, 1991 and 2010.
Figure 13: Age of new mothers, 1921,1971, 2001 and 2011
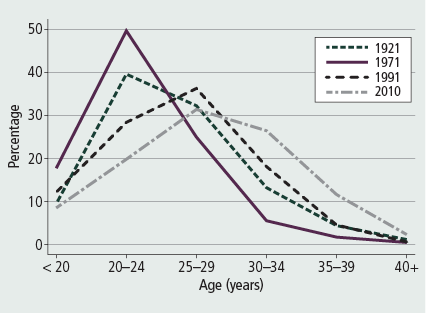
Note: The data for the years 1921 and 1971 exclude mothers who gave birth outside marriage.
Sources: Commonwealth Bureau of Census and Statistics (1922, 1973); Laws & Sullivan (2004); Li, Zeki, Hilder, & Sullivan (2012).
In 1921, 1971 and 1991, women most commonly had their first child when in their 20s. However, the age profiles of these new mothers varied considerably. In 1921 and 1971, a higher proportion of women had their first child when in their early 20s rather than the late 20s, with this trend being particularly marked in 1971 (during the "Baby Boom" period). Specifically, 50% of new mothers in 1971 and 40% of new mothers in 1921 were aged 20-24 years old, while 25% and 32% respectively were 25-29 years old. Furthermore, unlike all other years represented in Figure 13, becoming a mother when still a teenager was the third most common scenario for women in 1971 (representing 18% of all new mothers in that year).11
The shift towards later parenthood is clearly apparent in the 1991 data, when new mothers were more likely to be in their late 20s than their early 20s (36% vs 28%). In 2010, the trend continued, with women most commonly having their first child when in their late 20s, followed by the early 30s (31% and 26% respectively). Thus, the proportion of women having their first child in their late 30s was considerably higher in 2010 than in earlier years (12% vs around 5% in both 1921 and 1991, and only 2% in 1971). This is the only year represented in Figure 13 in which women were more likely to become mothers when in their late 30s than when teenagers (12% of all new mothers were in their late 30s, while 9% were teenagers). Interestingly, the proportion of new mothers who were teenagers in 2010 (9%) is little different from that apparent in 1921 (10%).
While the proportion of new mothers aged 40 or more years more than doubled across these years, few women became mothers at this age (ranging from less than 1% in 1971 to 2% in 2010).
The shapes of the age distributions depicted in Figure 13 differ considerably over the years. The distribution for 1971 indicates that these women's transition to parenthood tended to occur during a much narrower period in their lives than was the case for new mothers in the other years. The "flattest" distribution is apparent for 2010, showing that the ages at which women were having their first child in that year were more diverse than in the earlier years.
Increased delays in the formation of highly committed relationships, especially marriage, have contributed to the increased age at which women become mothers. Changes in the timing of these milestones, in turn, have their roots in the interaction of many factors, including improvements in the education levels of young women; the introduction of the contraceptive pill and increased availability of legal abortion; and the increasing participation of married women in paid employment, as restrictions on women's ability to work after marriage were lifted and the "opportunity costs" of relinquishing paid work increased.12 Other factors include the fragility of relationships, macro-level economic uncertainties, and changing attitudes and values that are influenced by, and reinforce, the timing of parenthood (for further discussions, see Lattimore & Pobke, 2008; McDonald, 2000; McDonald & Kippen, 2011; Weston, Qu, Parker, & Alexander, 2004).
Total fertility rate and total number of births
The total fertility rate refers to the average number of children an imaginary woman would have across her reproductive life were she to experience the current fertility rates observed for women of different ages. The total number of babies born each year, on the other hand, is a "real" figure that depends in obvious ways on the size of the population of women of childbearing age,13 the age at which women have their children, trends in partnerships (especially marriage), and preparedness to have children outside marriage.
The total fertility rate has changed in striking ways over the last 150 years. According to Hugo (2001), the fertility rate was nearly 4.0 at the beginning of the 20th century, having fallen by about one-third over the previous 30 years.14 Fertility fell in the second half of the nineteenth century, firstly in response to the decline in marriage rates, and later through increasing knowledge and acceptance of contraception, a period of massive unemployment (in the 1890s), and children becoming an expense rather than an economic asset. The change in the financial status of children occurred through the gradual implementation of compulsory schooling and the abolition of child labour (Caldwell, McDonald, & Ruzicka 1982; Gilding, 1991).
Figure 14 plots the fertility rates and numbers of births across the years from 1921 to 2011.
Figure 14: Numbers of births and total fertility rates, 1921-2011
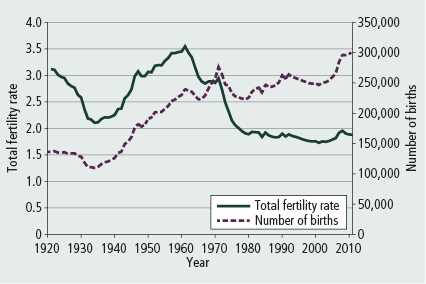
Note: Total fertility rate is the sum of age-specific fertility rates (live births at each age of mothers per female population of that age).
Sources: ABS. (various years). Births, Australia
The Great Depression marked an early low point in fertility, with 2.11 babies per woman born in 1934 - a level that is marginally higher than the current replacement rate (2.06). This fall apparently resulted more from deliberate birth control than from the postponement of marriage (Ruzicka & Caldwell, 1982).
The end of World War II sparked the Baby Boom years. As the economic outlook improved, marriage rates increased and births postponed during World War II took place, while the average age at first marriage fell. In fact, the Baby Boom was at the same time really a "marriage boom", for fertility rates within marriage changed little (Ruzica & Caldwell, 1982). There was also strong pressure on single women who were pregnant to marry before the birth of their child.15
The fertility rate reached its highest level for the century in 1961 (3.55), but by 1976, it had fallen to replacement level (2.06) for the first time. After stabilising in the 1980s to between 1.83 and 1.94, the fertility rate then fell in small progressive steps in the 1990s, reaching its lowest level on record in 2001 (1.73). By 2008, the rate had increased to 1.96, and then subsided slightly over the next three years (1.90 in 2009, 1.89 in 2010 and 1.88 in 2011). Overall, then, the rate has remained below the current replacement level over the last 35 years (since 1977), representing the lowest rates on record.
The modern decline in the fertility rate can be explained by the combination of various factors, including increases in the age at which women become mothers. The postponement of childbearing not only adds additional restrictions on the number of children women can have, but also increases the chances of being childless. Despite advances in assisted reproductive technology (ART), success rates of such treatments tend to diminish with women's advancing age, as they approach their mid-30s.16 Furthermore, only a small proportion of women who give birth each year have had some from of ART (around 4% in Australia in 2009; see Macaldowie et al., 2012).
Over the period represented in Figure 14, the total number of births per annum has more than doubled, from 136,200 in 1921 to 301,600 in 2011. Although the increase has been mostly linear, given the increasing size of the population, troughs and peaks have occurred during recessions and recoveries. The most prolonged period of relatively high rates of increase in the number of births occurred from just after the time of the Great Depression of the early 1930s to 1961, the period when the fertility rate peaked. The number of babies born in 1961 was more than twice that of 1932 (240,000 vs 111,000).
Age-related fertility rates
As explained above, the total fertility rate is a synthetic figure, based on the sum of age-specific fertility rates. Figure 15 shows that trends in fertility rates have varied markedly according to women's age. These rates refer to the number of live births in a given year occurring (or registered) to women of a particular age, for every 1,000 women of the same age.17
Figure 15: Age-specific fertility rates, 1921-2011
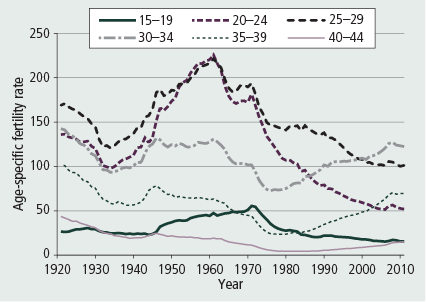
Note: Age-specific fertility rate is the live births at each age of mother per 1,000 of the estimated female population of the same age.
Sources: ABS. (various years). Births, Australia
The fertility rate for virtually all ages fell in the 1920s and early 1930s, then increased, with the most dramatic increase occurring for those aged in their early and late 20s. From the 1950s to mid-1970s, the fertility rate of women in these two age groups was markedly greater than that of all other groups. The fall in fertility rate after 1961 was particularly striking for women in aged 20-24 years. In recent years, this group has had the fourth highest rate of those depicted.
Across most of the years shown, women in their late 20s had the highest fertility rates of all women, with the greatest differences occurring in the 1920s and 1930s, then in the 1980s. However, during the new millennium, the fertility rate of women in their early 30s has overtaken that of all groups. Like those in their early 30s, the rates of those aged in their late 30s and early 40s have mostly increased since around 1980, but like all other age groups, they remain lower than those apparent in 1920.
Ex-nuptial births
While the total fertility rates over the past 35 years have been the lowest on record, the proportions of babies born outside of a registered marriage have increased markedly during this period (Figure 16).
Figure 16: Ex-nuptial births as a proportion of all births, 1901-2011
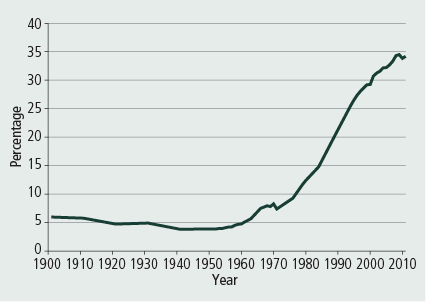
Sources: Commonwealth Bureau of Census and Statistics. (various years). Official Year Book of the Commonwealth of Australia/Official Year Book of Australia; ABS. (various years). Year Book Australia; ABS. (various years). Births, Australia.
For most of the 20th century, around 4-6% of all births were ex-nuptial, rising to 8% in the late 1960s. Then, over the 35 years from 1970 to 2005, the proportion quadrupled from 8% to 32%; however, this trend has levelled off in recent years, with 33-34% of all births being ex-nuptial between 2006 and 2011.
It appears that the rise in ex-nuptial births can be attributed almost entirely to the increase in the proportion of babies born to cohabiting parents. That is, cohabitation has increasingly become a setting for raising children. Perinatal statistics published by the Australian Institute of Health and Welfare suggest that the proportion of births to unpartnered mothers has remained stable for the periods investigated (around 12-13% between 1991 and 2005) (Lancaster, Huang, & Pedisich, 1994; Laws, Abeywardana, Walker, & Sullivan, 2007; Nassar & Sullivan, 2001).18
Concluding comments
Significant changes have occurred in patterns of relationship formation and dissolution and childbearing over the last century and into the new millennium, with many of the changes of the most recent few decades being unprecedented.
Marriages have been occurring at increasingly later ages, and cohabiting relationships have become increasingly common, especially among young people. Nevertheless, most adults today are married or will marry during the course of their lives.
The increase in the divorce rate in 1976 (when the Family Law Act 1975 came into operation) represents one of the most spectacular family-related transitions, and although the rate subsided soon after, it has remained higher since then than in earlier times. However, the divorce rate is no longer an adequate indicator of the level of relationship instability due to the rise in cohabitation rates and the relative instability of these relationships compared to marriages.
The net effect of these various trends is that the overall partnership rates of middle-aged men and women have fallen. However, partnership rates of older men and women have increased, owing at least in part to a narrowing of the gap in the life expectancies between men and women. The increase in partnership rates among older people lowers demand for residential care among those with health issues that are manageable with the care of a partner.
The total fertility rate fell in response to the recession of the 1930s, then reached a peak in the so-called "Golden Era" of the post-World War II period, but has mostly fallen since then, reaching its lowest level in 2001. The rate has been below the current replacement level over the last 35 years.
The patterns outlined in this facts sheet suggest increasing diversity in some life course transitions (e.g., age at marriage and at first birth) and increasing uniformity in at least one other (e.g., the tendency to cohabit in the early stages of a relationship). If increasing proportions of young women in the future have their first child when they are in their late 20s or early 30s (the most common ages at present), such a practice would mean that the current level of diversity regarding the timing of first birth in women's lives will diminish. On the other hand, one of the key lessons of history is that family trends can change in unexpected ways. Policy decisions that are likely to have substantial long-term repercussions therefore need to take account of the fact that, while "change is a constant", the nature of future change can take us by surprise.
References
- Australian Bureau of Statistics. (1997). Australian social trends 1997 (Cat. No. 4102.0). Canberra: ABS.
- Australian Bureau of Statistics. (2001a). Births, Australia 2000 (Cat. No. 3301.0). Canberra: ABS.
- Australian Bureau of Statistics. (2001b). Marriages and divorces Australia 2000 (Cat. No. 3310.0). Canberra: ABS.
- Australian Bureau of Statistics. (2002). Australian social trends 2002 (Cat. No. 4102.0) Canberra: ABS.
- Australian Bureau of Statistics. (2007). 2001 Census of Population and Housing: Time series profile (Cat. No. 2003.0). Canberra: ABS.
- Australian Bureau of Statistics. (2012a). 2011 Census of Population Housing: Basic community profile (Cat. No. 2001.0). Canberra: ABS.
- Australian Bureau of Statistics. (2012b). 2011 Census of Population and Housing: Time series profile (Cat. No. 2003.0). Canberra: ABS.
- Australian Bureau of Statistics. (2012c). Births, Australia 2011 (Cat. No. 3310.0) Canberra: ABS.
- Australian Bureau of Statistics. (2012d). Marriages and divorces Australia 2011 (Cat. No. 3310.0). Canberra: ABS.
- Australian Bureau of Statistics. (2012e). Reflecting a nation: Stories from the 2011 Census, 2012-2013. Same-sex couple families (Cat. No. 2071.0). Canberra: ABS.
- Australian Institute of Health and Welfare. (2012). Adoptions Australia 2011-12 (Child Welfare Series No. 54; Cat. No. CWS 42). Canberra: AIHW.
- Caldwell, J. C., McDonald, P. F., & Ruzicka, L. T. (1982). Nuptiality and fertility in Australia, 1921-1976. In L. T. Rizicka (Ed.), Proceedings of a seminar held in Bruges, Belgium, 8-11 January 1979. Liegue: International Union for the Scientific Study of Population.
- Carmichael, G. A. (1984). The transition to marriage: Trends in age at first marriage and proportions marrying in Australia. In Australian Family Research Conference proceedings: Family formation, structure, values (Vol. 1). Melbourne: Australian Institute of Family Studies.
- Carmichael, G. A. (1995). Consensual partnering in the more developed countries: An overview. (Working Papers in Demography No. 56). Canberra: Division of Demography and Sociology, Research School of Social Sciences, Australian National University.
- Carmichael, G. A., & McDonald, P. F. (1987). The rise and fall(?) of divorce in Australia, 1968-1985. In Proceedings of the Third Australian Population Association Conference (1986). Adelaide: Flinders University of South Australia.
- Cherlin, A. (2004). The deinstitutionalization of American marriage. Journal of Marriage and Family, 66, 848-861.
- Coleman, M., Ganong, L., & Fine, M. (2000). Reinvestigating remarriage: Another decade of progress. Journal of Marriage and the Family, 62, 1288-1307.
- Commonwealth Bureau of Census and Statistics. (1922). Official year book of the Commonwealth of Australia (No. 15). Canberra: Commonwealth Bureau of Census and Statistics.
- Commonwealth Bureau of Census and Statistics. (1973). Official year book of Australia (No. 59). Canberra: Commonwealth Bureau of Census and Statistics.
- Coughlan, W. G. (1957). Marriage breakdown. In A. P. Elkin (Ed.), Marriage and the family in Australia. Sydney: Angus & Robertson.
- Finlay, H. (2005). To have but not to hold: A history of attitudes to marriage and divorce in Australia 1958-1975. Leichhardt, NSW: The Federation Press.
- Gilding, M. (1991). The making and breaking of the Australian family. North Sydney, NSW: Allen and Unwin.
- Hugo, G. (2001). A century of population change in Australia. In Australian Bureau of Statistics, Year book Australia 2001 (Cat. No. 1301.0). Canberra: ABS.
- Kenny, P., Higgins, D., Soloff, C., & Sweid, R. (2012). Past adoption experiences: National Research Study on the Service Response to Past Adoption Practices (Research Report No. 21). Melbourne: Australian Institute of Family Studies.
- Lancaster, P., Huang, J., & Pedisich, E. (1994). Australia's mothers and babies 1991 (National Perinatal Statistics No. 1). Canberra: Australian Institute of Health and Welfare.
- Lattimore, R., & Pobke, C. (2008). Recent trends in Australian fertility (Productivity Commission Staff Working Paper). Canberra: Productivity Commission.
- Laws, P., Abeywardana, S., Walker, J., & Sullivan, E. (2007). Australia's mothers and babies 2005 (National Perinatal Statistics No. 20). Canberra: Australian Institute of Health and Welfare.
- Laws, P. J. & Sullivan, E. A. (2004). Australia's mothers and babies 2001 (Perinatal Statistics Series No. 13). Canberra: Australian Institute of Health and Welfare.
- Li, Z., Zeki, R., Hilder, L., & Sullivan, E. A. (2012). Australia's mothers and babies 2010 (Perinatal Statistics Series No. 27). Canberra: Australian Institute of Health and Welfare.
- Macaldowie, A., Wang Y. A., Chambers, G. M., & Sullivan, E. A. (2012). Assisted reproductive technology in Australia and New Zealand 2010 (Assisted Reproduction Series, No. 16; Cat. No. PER 55). Canberra: Australian Institute of Health and Welfare.
- McDonald, P. (1995). Families in Australia: A socio-demographic perspective. Melbourne: Australian Institute of Family Studies.
- McDonald, P. (2000). Low fertility in Australia: Evidence, causes and policy responses. People and Place, 8(2), 6-20.
- McDonald, P., & Kippen, R. (1999). Population futures for Australia: The policy alternatives (Research Paper No. 5). Canberra: Parliamentary Library of Australia. Retrieved from <https://digitalcollections.anu.edu.au/html/1885/41933/2000rp05.htm>.
- McDonald, P., & Kippen, R. (2011). Australian Census Analytic Program: Forecasting births 2006 (Cat. No. 2051.0). Canberra: Australian Bureau of Statistics.
- Nassar, N., & Sullivan, E. 2001, Australia's mothers and babies 1999 (National Perinatal Statistics No. 11). Canberra: Australian Institute of Health and Welfare.
- Nicholson, A., & Harrison, M. (2000). Family law and the Family Court of Australia: Experiences of the first 25 years. Melbourne University Law Review, 24(3), 756-783.
- Parker, S., Parkinson, P., & Behrens, J. (1999). Australian family law in context: Commentary and materials (2nd ed.). Sydney: LBC Information Services.
- Ruzicka, L. T., & Caldwell, J. C. (1982). Fertility. In Economic and Social Commission for Asia and the Pacific, Population of Australia (Vol. 1, pp. 199-229; Country Monograph Series No. 9). New York: United Nations.
- Qu, L., & Soriano, G. (2004). Forming couple relationships: Adolescents' aspirations and young adults' actualities. Family Matters, 68, 43-49.
- Qu, L., & Weston, R. (2008a). Attitudes towards marriage and cohabitation. Family Relationships Quarterly, 8, 5-10.
- Qu, L., & Weston, R. (2008b). Snapshots of family relationships. Melbourne: Australian Institute of Family Studies.
- Santow, G., & Bracher, M. (1994). Change and continuity in the formation of first marital unions in Australia. Population Studies, 48(3), 475-496.
- Smart, D. (2002). Relationships, marriage and parenthood: Views of young people and their parents. Family Matters, 63, 28-35.
- Weston, R., Stanton, D., Qu, L., & Soriano, G. (2001). Australian families in transition: Socio-demographic trends 1901-2001. Family Matters, 60, 12-23.
- Weston, R., Qu, L., Parker, R., & Alexander, M. (2004). "It's not for lack of wanting kids": A report on the Fertility Decision Making Project (Research Report No. 11). Melbourne: Australian Institute of Family Studies.
1 Much of the discussion in this facts sheet uses data from the Australian Bureau of Statistics (ABS; formerly the Commonwealth Bureau of Census and Statistics). Key sources are various issues of: Marriages and Divorces Australia (Cat. No. 3310.0); Births Australia (Cat. No. 3301.0), and Official Year Book of the Commonwealth of Australia/Official Year Book of Australia/Year Book of Australia (Cat. No. 1301.0). This facts sheet also draws on work by Weston, Stanton, Qu, and Soriano (2001). Other sources used are listed in the references.
2 However, our understanding of parameters that should be taken into account in forecasting some shorter term trends is improving (e.g., see McDonald & Kippen, 2011, in relation to forecasting fertility trends).
3 Calculated from data in the Australian Demographic Database (Australian Demographic and Social Research Unit, Australian National University).
4 The stigma associated with childbirth outside marriage is also reflected in adoption practices at the time. Prior to the mid-1970s, unwed mothers were strongly encouraged, or forced, to relinquish their child for adoption. The annual number of adoptions peaked at nearly 10,000 in 1971-72, but dropped rapidly after that and remained stable at around 400-600 in the following decades (Kenny, Higgins, Soloff, & Sweid, 2012). However, in 2011-12, there were only 333 adoptions in Australia, which is the lowest number on record (AIHW, 2012).
5 The cohabiting population includes both heterosexual (non-married) unions and same-sex unions. It is only since 1996 that the Australian Census has compiled counts of same-sex couples. In 2011, fewer than 1% of cohabiting unions were recorded as same-sex unions (ABS, 2012e), so the trends in this section closely approximate those for heterosexual unions.
6 Of all couples living together, the proportion who were cohabiting but not married appears to have increased from 6% in 1986, to 8% in 1991, 10% in 1996, 12% in 2001, 15% in 2006, and 16% in 2011 (ABS, 2002, 2012a; Carmichael, 1995; Santow & Bracher, 1994).
7 The crude divorce rate was 2.2 in 2008 and 2011.
8 In 2011, 48,935 divorces took place, down from 50,240 in the previous year, and 49,448 in 2009.
9 Rates of remarriage among divorced and widowed men and women of different ages are not available for recent years.
10 These data focus exclusively on people in private dwellings. The pattern remains the same if all those in Australia are included (see notes to Figures 11 and 12 for groups omitted). People aged 85 or more years were the most likely to be living in non-private dwellings. Between 1996 and 2011, the proportions of men and women of this age living in private dwellings fell (men: from 29% to 24%; women: from 43% to 36%).
11 The year 1971 was also the period in which the number of adoptions peaked in Australia (amounting to almost 10,000). Many of the adopted babies would have been born to unmarried teenagers (see Kenny et al., 2012).
12 "Opportunity costs" refer to current and future benefits that would be relinquished in choosing a course of action. In the present context, "opportunity costs" ultimately refer to the total income that would be foregone by mothers over their lifetime by giving up paid work.
13 Population size depends on levels of natural increase (i.e., the ratio of births to deaths) and net immigration.
14 In NSW, the fall in the birth rate in the late 19th century sparked a royal commission of inquiry in 1903 to investigate its reasons, and the conclusions drawn focused on the fact that couples were making the conscious decision to use birth control measures.
15 According to McDonald (1995), the proportions who were pregnant reached a peak in the mid-1960s (applying to one-quarter of all brides).
16 Age-related success rates vary according to type of ART treatment. Macaldowie, Wang, Chambers, & Sullivan, 2012, analysed success rates of various ARTs performed in 2010 in Australia and New Zealand, and noted that the number of ART treatment cycles performed diminished in 2010, coinciding with changes in government funding for such treatments.
17 More precisely, the ABS (2012c) provides the following explanation of the nature and derivation of age-specific fertility rates: "Age-specific fertility rates … are the number of live births (occurred or registered) during the calendar year, according to the age of the mother, per 1,000 of the female estimated resident population of the same age at 30 June. For calculating these rates, births to mothers under 15 years are included in the 15-19 years age group, and births to mothers aged 50 years and over are included in the 45-49 years age group. Pro rata adjustment is made for births for which the age of the mother is not given" ("Age-specific fertility rates" <tinyurl.com/bm4uqzx>).
18 Specifically, of all babies born in the years examined, the proportion who were born to unpartnered women were: 12.2% in 1991, 12.7% in 1995, 12.9% in 2000, and 12.6% in 2005. Statistics on this issue have not been provided in more recent reports released by the AIHW.
Ruth Weston is Assistant Director (Research) and Lixia Qu is a Senior Research Fellow at the Australian Institute of Family Studies.
Weston, R., & Qu, L. (2013). Working out relationships (Australian Family Trends No. 3). Melbourne: Australian Institute of Family Studies.
978-1-92208-8-9