Young people living with parents
Facts and Figures 2023
June 2023

Overview
Leaving the parental home typically represents one of the main steps that young people make in the transition to an independent adult life. This report provides insights on this transition by exploring patterns of young people aged 15–34 years living with parents or living away from parents, by age and a range of other personal and family factors. It also compares some circumstances, such as income and employment, of those living with parents versus living elsewhere for young people aged under 30 years across broad age groups.
Most analysis uses the 2021 Australian Census of Population and Housing (the Census)1.
Some earlier census years are included to explore changing patterns. The 2021 Census was conducted during the COVID pandemic and young people’s decisions about living in the parental home at this time may have been influenced by ongoing restrictions and labour market conditions (Evans-Whipp & Prattley [AIFS], 2023; Hand, Baxter, Carroll, & Budinski [AIFS], 2020).2
1 Data were extracted using Tablebuilder. Young people are classified as living with parents if they were identified in the census as dependent students or non-dependent children in families or households. ‘Living with parents’ includes those living with one or two parents, with parents not necessarily children’s biological or adoptive parents. A small number of young people living with parents may not be captured, if in a family with more complex family relationships that mean the relationship between co-resident child and parent is not identified in the census classification. Visitors to the household on census night were excluded when deriving percentages.
2 For some related research, using earlier data from the Household Income and Dynamics study (HILDA), see Wilkins and Vera-Toscano (2019).
More young people living with parents
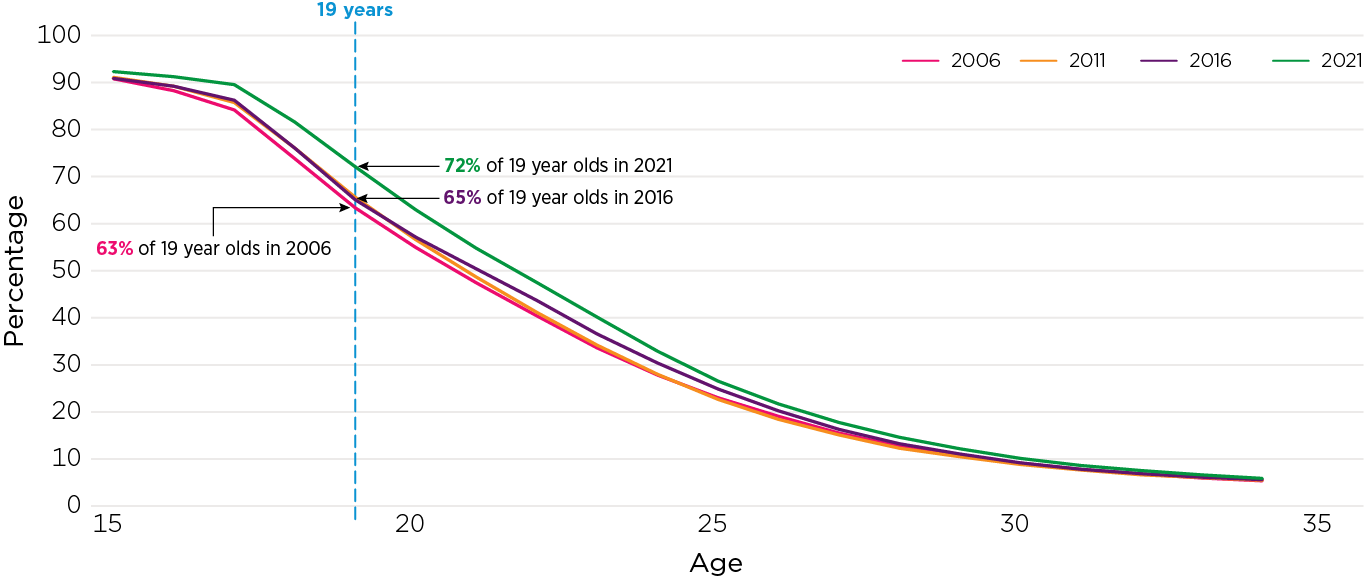
Figure 1 shows the proportion of young people living with parents by age in four census years since 2006. Single years of age is used in this first analysis, with later analysis using five-year age group spans.
- The vast majority of 15 year olds lived with parents (92% in 2021).
- The proportion of young people living at home with parents declined with age, with the drop accelerating from 18 years of age when many finish secondary education.
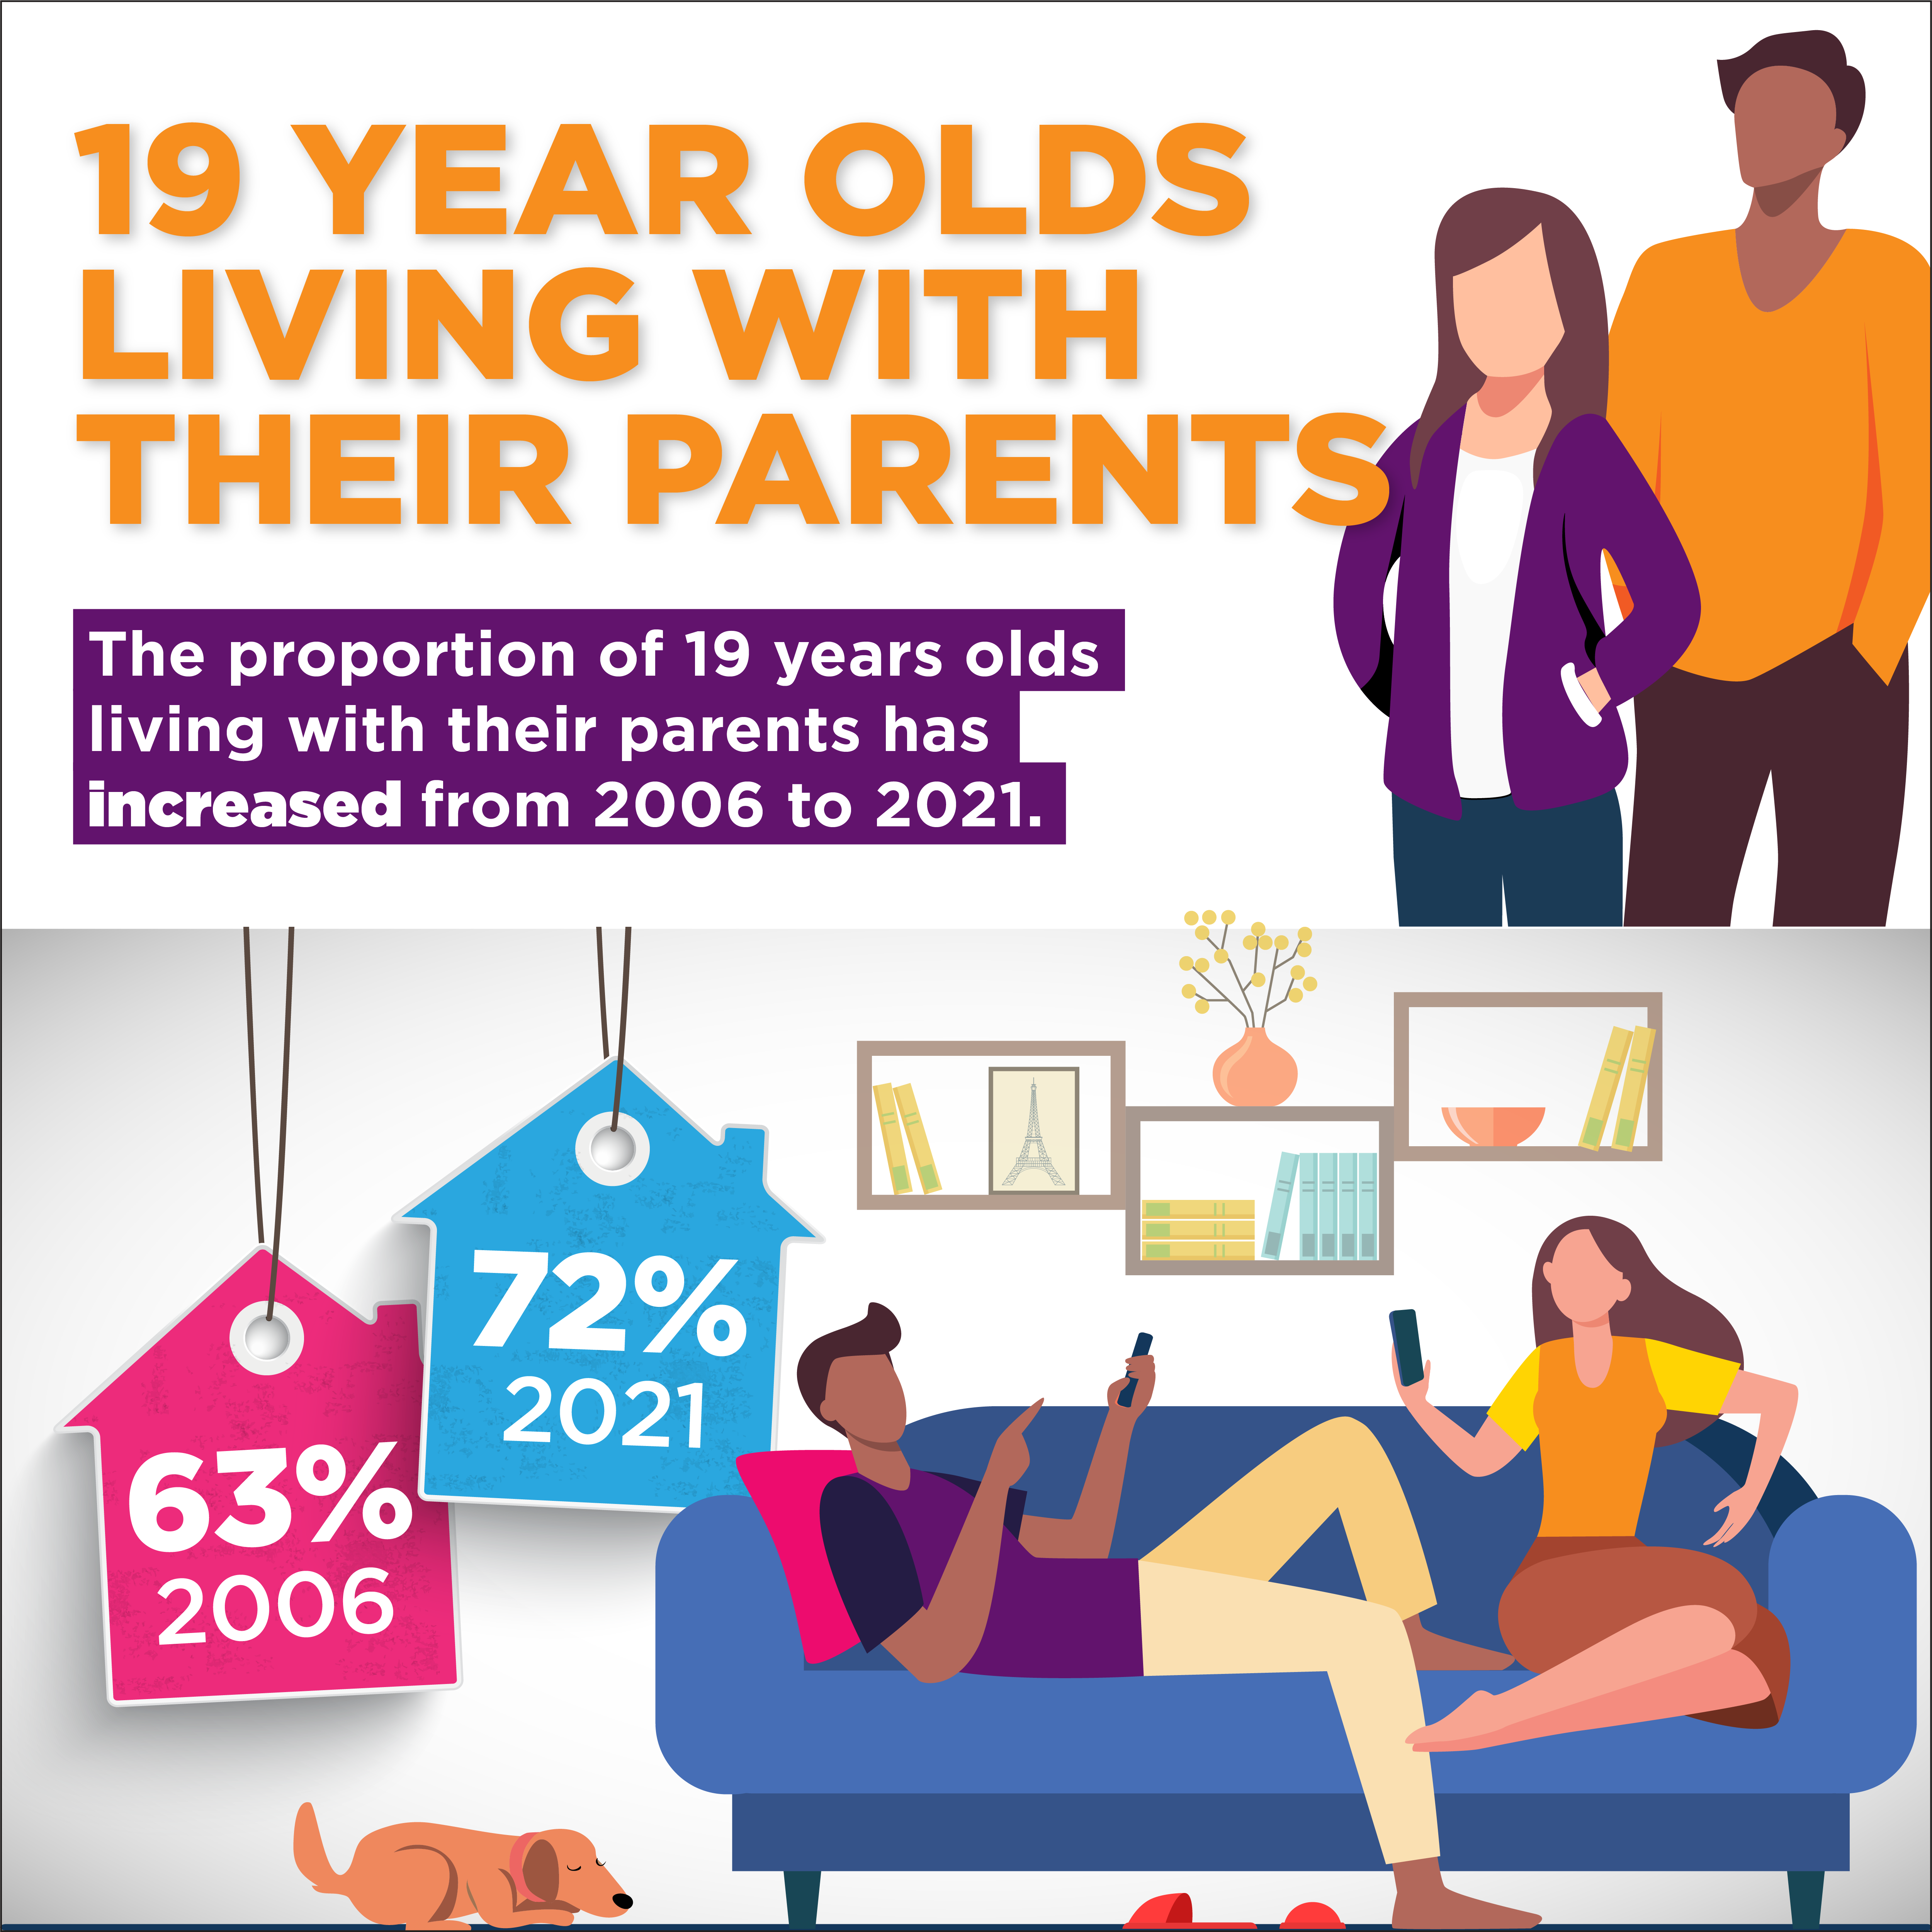
- The proportion living at home with parents has increased from 2006 to 2021. This pattern applies to every age until the early thirties. It is more marked for the late teen years and early twenties. The biggest difference was found at 19 years of age; in 2006, 63% of 19 year olds were living with their parents and this had increased to 72% in 2021.
- Across four census periods, the increase in the proportion of young adults living with parents was more pronounced between 2016 and 2021 compared to the three previous inter-census periods. Again, the patterns were particularly evident in the late teen years and early twenties age groups.
Figure 1: Numbers of young people living with parents longer continue to increase
Percentage living with parents, by age, 2006–21
Sources: ABS censuses
Young people not living with parents
Most young people (15–34) who were not living with parents were living with others in a private dwelling (Table 1). The most common non-private dwellings for 15–34 year olds were college halls of residence and staff quarters.
Table 1: Young people not living with parents were mostly living with others in private dwellings
Household composition if not living with parents, by age, 2021
| % | 15–19 | 20–24 | 25–29 | 30–34 |
|---|---|---|---|---|
| Living with others in a private dwelling | 75% | 83% | 86% | 88% |
| Living alone | 5% | 9% | 10% | 9% |
| Living in a non-private dwelling | 20% | 8% | 4% | 3% |
Source: ABS, 2021, Census TableBuilder
Figure 1 shows some 15 year olds are already not living with parents (8%). Among these young people, the two most common arrangements were living with other relatives (such as grandparents) and living at boarding schools or residential colleges:
- 37% lived with other relatives (mostly grandparents followed by uncles/aunts)
- 6% lived at boarding schools/residential colleges
- 8% lived with people they are not related to
- The remainder lived in different arrangements including in non-private and private dwellings.
Which young people are living with parents?
Young men and women increasingly living with their parents
The age-related patterns for grouped ages are shown separately for young men and women (Figure 2).
- The trend towards increasingly living with parents to later ages crosses the gender divide, being apparent for young men and women.
- Young women aged 20–24 had the most drastic shift, with 43% living with parents in 2021 compared to 36% in 2006, a 7-point increase.
- While less marked, young men also experienced the greatest increase over time at ages 20–24 years, from 46% in 2006 to 51% in 2021, a 5-point increase.
Comparison of the male to female proportions at each age show that young men were more likely to be living with parents than were young women. This was especially apparent for 20–24 year olds and upward. These gender differences are, at least in part, related to some young women leaving the parental home before the men do to form relationships and start their own families. See New relationships and children below for related data.
See also Marriages in Australia.
Figure 2: Men were more likely than women to live with parents at all ages, though percentages increased for both women and men
Percentage living with parents, by age group and sex, 2006–21
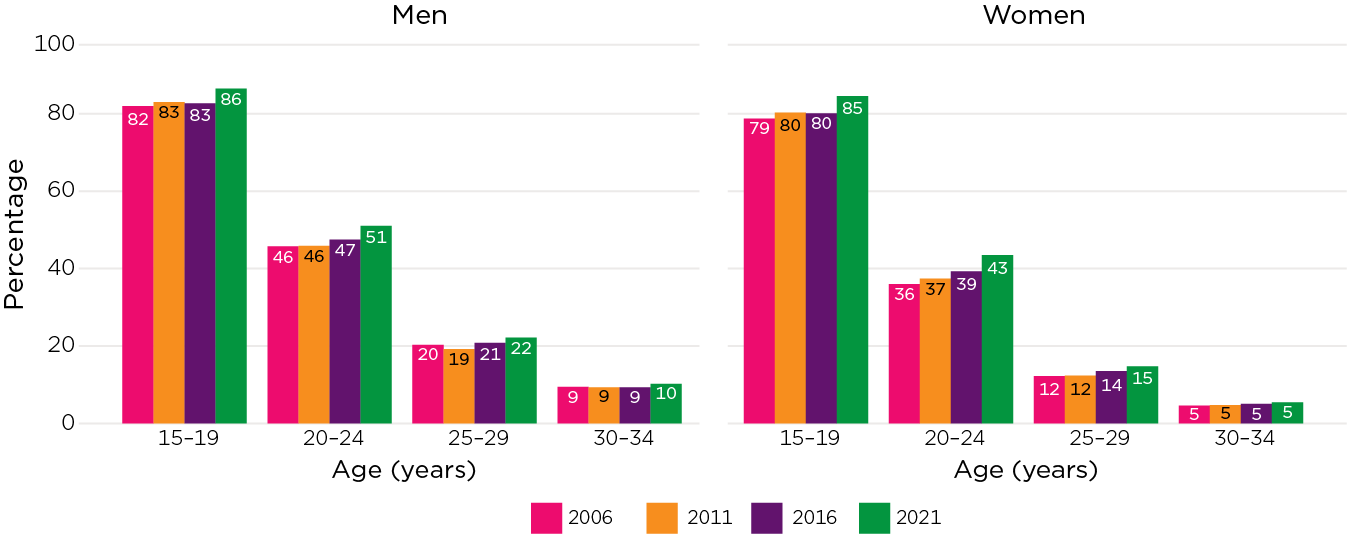
Sources: ABS censuses
Regional young adults leave home earlier
Figure 3 shows how the patterns of living with parents varied for those living in capital cities (including their surrounds, or ‘Greater Capital Cities’3) versus those living in regional areas at the time of the 2021 Census.
Overall, these data indicate that young men and women in capital cities were more likely to be living with parents.
- For example, of young men aged 20–24, 53% of those in capital cities were living with their parents compared to 45% of those living in regional areas.
- This difference was even greater among young women of the same age range, with 47% in capital cities living with parents, compared to 34% for those living in regional areas.
One of the factors related to the lower rates of living with parents in regional areas is that the timing of young people forming couple relationships and having children starts earlier in regional areas than in capital cities.
This will correspond to lower rates of living with parents in young adulthood. For example:
- Among 20–24-year-old women living away from parents, those in regional areas were more likely to be living with a partner (45%) compared to those in capital cities (36%).
- For 20–24-year-old men living away from parents, the percentage living with a partner was 35% in regional areas and 25% in capital cities.
For both men and women aged 20–24 years and living away from parents, the other main living arrangement was in a share house. In regional areas, this was the living arrangement for 26% of women and 30% of men, compared to 34% of women and 43% of men in capital cities.
Another common reason for leaving the parental home is for young people to take up work or study opportunities that are not near to their parents’ home, including moving to larger urban areas (Vij, Ardeshiri, Li, Beer and Crommelin 2022). While relocation to capital cities may be relevant to young people growing up in regional areas, young people having done this will be captured in the ‘capital city’ data. If young people instead move from the parental home for work or study reasons but remain in a regional area, this will contribute to higher rates of living away from parents in the regional areas.
Some people will remain at home because they are unable to afford living independently. The availability of affordable housing is likely a factor, with this expected to vary across regions of Australia (see discussion in Wilkins & Vera-Toscano, 2019). However, there are complex patterns related to family formation, work and study as well as socio-economic reasons that might contribute to the differences between capital city and regional areas in the proportion of young people living at home.
Figure 3: Living with parents more likely in capital cities
Percentage living with parents in capital cities and regional Australia, by age group and sex, 2021
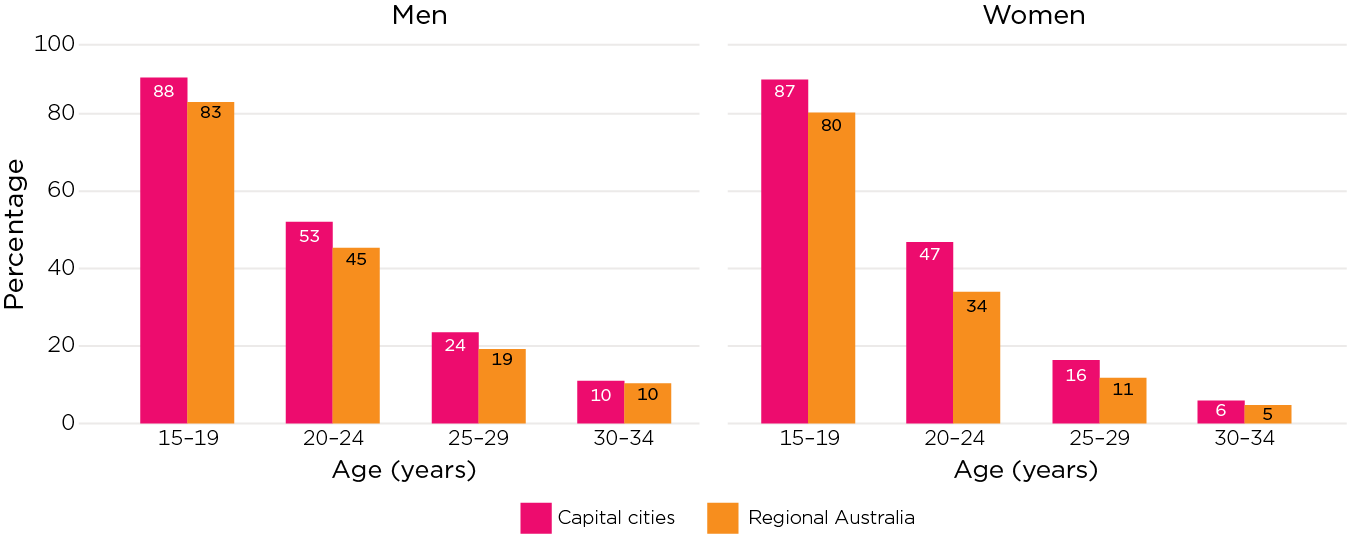
Source: ABS 2021 Census TableBuilder
Comparing ethnic backgrounds
Cultural background influences the likelihood that a young person will live in the family home for longer, with different norms and values across cultures relevant to the timing of transitioning out of the parental home (see e.g. van den Berg, Kalmijn, & Leopold, 2021).
Differences by ethnicity were explored for Australian-born young people by using information on ancestry collected in the Census. 4 This analysis focuses on the age groups when differences by cultural background were most likely to be apparent, at 20–29 years, rather than on those younger or older.
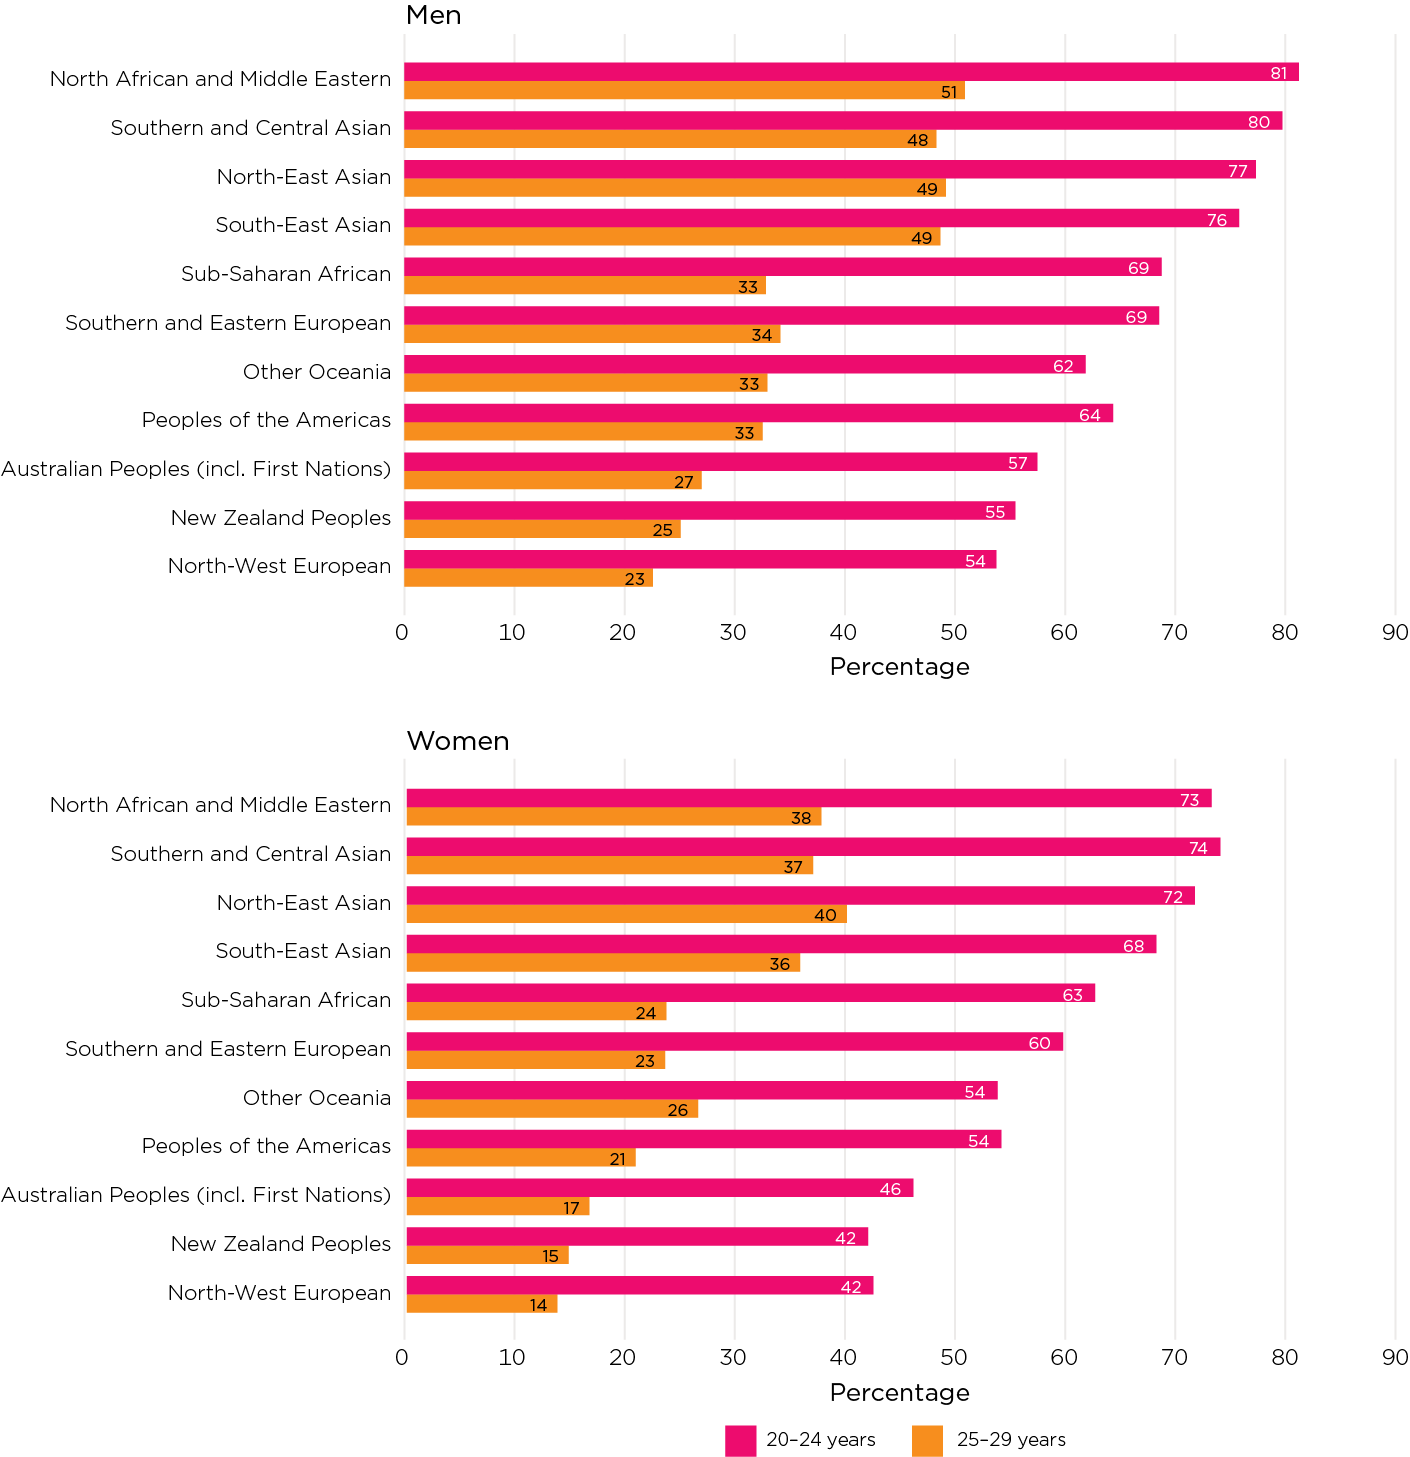
Figure 4 shows that among Australian-born young adults:
- Those with Asian, Middle Eastern, African or Southern and Eastern European ancestry were the most likely to live with their parents.
- Those with Australian, North-Western European or New Zealand backgrounds were the least likely to live with their parents.
These patterns applied to both young men and young women at both 20–24 years and 25–29 years.
Figure 4: Those from some cultural backgrounds such as Asia, the Middle East, and Northern Africa live with parents longer
Percentage of men and women living with parents by age group and ancestry, 2021
Source: 2021 Census TableBuilder
Non-indigenous young people more likely to be living with parents
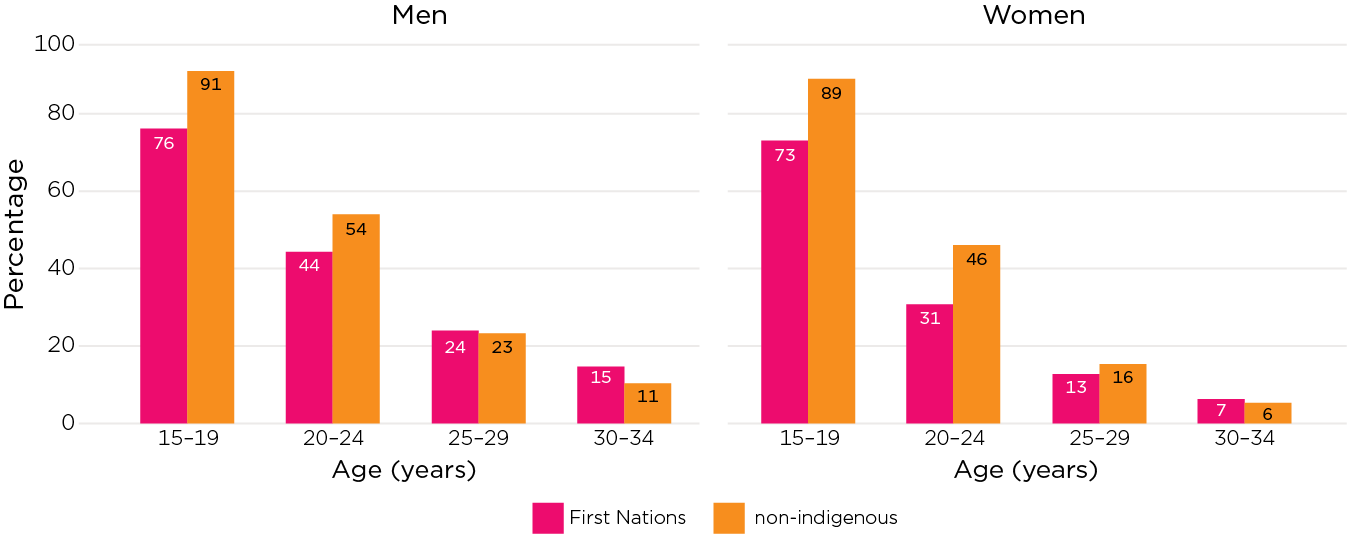
Figure 5 presents the proportions of young First Nations (Aboriginal and/or Torres Strait Islander 5) and non-indigenous people living with parents, by gender and age group.
- First Nations youth were less likely to live with their parents between the ages of 15 and 24.
- For example, for men aged 15–19, 76% of First Nations youth lived with their parents compared to 91% of non-indigenous youth. For women aged 15–19, 73% of First Nations youth lived with their parents compared to 89% of non-indigenous youth. For each, this is a 15–16 percentage point difference.
- From 25 years on there were smaller differences in the proportion living with parents between First Nations and non-indigenous young adults.
We note that some differences in the meaning of family according to First Nations status are expected. First Nations families tend to be defined more inclusively than other Australian families (Morphy, 2007), making it more common for young people to be living with relatives other than parents, such as grandparents, uncles and aunties. 6 - Family composition data from the 2021 Census shows that 11% of First Nations 15–19 years-olds lived with other related family members, compared to 3% of non-indigenous 15–19 year olds.
Figure 5: Younger First Nations Australians less likely to live with parents
Percentage of men and women living with parents by First Nations status and age group, 2021
Note: Those who did not state their indigenous status were excluded from tabulation.
Source: ABS 2021 Census TableBuilder
Young people with disability more likely to live with their parents than those without
Young people living with disability may remain living with parents longer, if parents are providing some level of care to them. This is explored using the Census item on individuals needing assistance in their day-to-day lives due to a disability or chronic condition.
According to the 2021 Census data, among those aged 15–34 years, those needing assistance with their day-to-day lives due to disability or a chronic condition were more likely to live with their parents (68% vs 38%).
- The difference was especially marked for those aged 20–34 years (56% of those needing assistance lived with parents compared to 24% of those who did not need assistance). For example, at 30–34 years, those needing assistance were five times more likely to live with their parents (38% vs 8%).
- There was a lesser difference for those 15–19 years (92% of those needing assistance, compared to 89% of those who did not), given the high rates of young people at that age living with parents.
Differences by age and gender are shown in Figure 6.
- Both men and women needing assistance were similarly likely to live with parents at 15–19 years (93% vs 91%) but gender differences emerged with age; consistent with the overall gendered patterns described above. At 20–24 years, 79% of men needing assistance and 65% of women needing assistance were living with parents. At 30–34 years, the difference between men and women was 18 percentage points (47% vs 29%).
Figure 6: Young people aged 20 years and older with disability more likely than those without to live with their parents
Percentage of men and women living with parents, by age group and whether needs help with daily activities, 2021
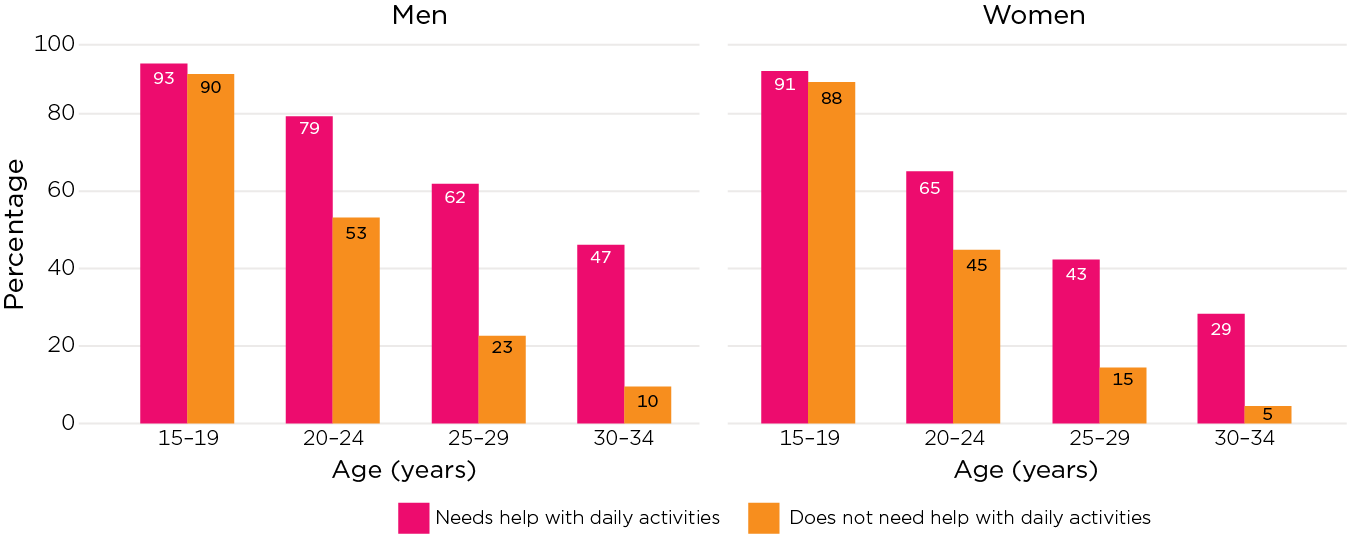
Note: ‘Needs help with daily activities’, or disability, used the Census question identifying those who need assistance in their day-to-day lives due to a disability or chronic condition. ‘Not-stated’ responses excluded from analysis.
Source: ABS 2021 Census TableBuilder
3 The Greater Capital City Statistical Areas used here include ‘populations who regularly socialise, shop or work within the city, but may live either in the city or in the small towns and rural areas surrounding the city’ (ABS, July 2021–June 2026).
4 Ancestry is captured for each person in the census. They were asked to pick up to two ancestries from a list of different regional/ethnic backgrounds. People may be captured under one or two of the ancestry categories shown in Figure 4. To explore whether living with parents by ethnicity (ancestry), we need to take account of there being many young people who have come from overseas to undertake study. To avoid this confounding the analysis, a subset of the Australian population is explored, that of young people who were born in Australia. Overall, 71% of 20–29 year olds living in Australia at the time of the 2021 Census were Australia-born.
5 In the 2021 Census, individuals were asked whether they were of ‘Aboriginal or Torres Strait Islander origin’. With the options to select either or both.
6 Families and households as defined by the ABS for statistical purpose typically cannot capture the circumstances of First Nations Australians, especially those living in remote communities with overlapping kinship networks and high, non-random mobility (Morphy, 2007). ‘Kin’ and ‘family’ have more or less the same meaning and may be understood more broadly in First Nations communities.
Comparing those living with parents and those not
Overview
This section changes focus to explore some aspects of young people’s lives according to whether or not they lived with parents. For this analysis, the focus was on young people aged 15–29 years. The older 30–34 years’ age group was excluded, given the smaller likelihood of living with parents at this age. This section covers young people’s participation in study and employment, young people’s personal income, and whether they were undertaking caring activities. First, some contextual data about relationships and children are included.
New relationships and children
It is useful to note some family-related factors about young people’s lives that may be relevant. This analysis is provided for context and does not differentiate by whether living with parents. 7
During young adulthood, a key transition for many is beginning relationships, and for some this includes marriage and/or cohabitation with a partner or spouse. The percentage living with a partner (married or de facto) was 8:
- 1% of men and 2% of women at 15–19 years
- 13% of men and 22% of women at 20–24 years
- 40% of men and 52% of women at 25–29 years.
Another key transition for some in their twenties is starting to have children. While this is clearly important for men as well as women, it is often associated with significant disruptions in employment for women, and not for men. Data on the number of children ever had in the Census is only collected for women. 9
- At 15–19 years, 1% of women had had a first child.
- At 20–24 years, 8% of women had had a first child.
- At 25–29 years, 26% of women had had a first child.
Young adults living with their parents more likely to engage in study
Figure 7 shows the extent to which young people are studying full-time or part-time and how it decreases over age for both genders. Within each age group, women were more likely to be engaged in study than men.
As shown in Figure 7, according to the 2021 Census:
- Young people living with parents were more likely to be engaged in study than those who were not. Across genders, 85% of 15–19 year olds who lived with their parents were studying part-time or full-time, compared to 63% of those not living with their parents. Most were studying full-time, particularly those living with parents.
- For young men aged 20–24 years, there was no difference in the proportion studying by whether living with parents. For the same age range of women, those living with parents were more likely to be engaged in study (51% vs 42%).
- For 25–29 year olds, no differences were apparent for women, and only small differences emerged for men.
Figure 7: Young people living with parents more likely than those not living with parents to be studying
Percentage of men and women in full-time or part-time study by age group and whether living with parents, 2021
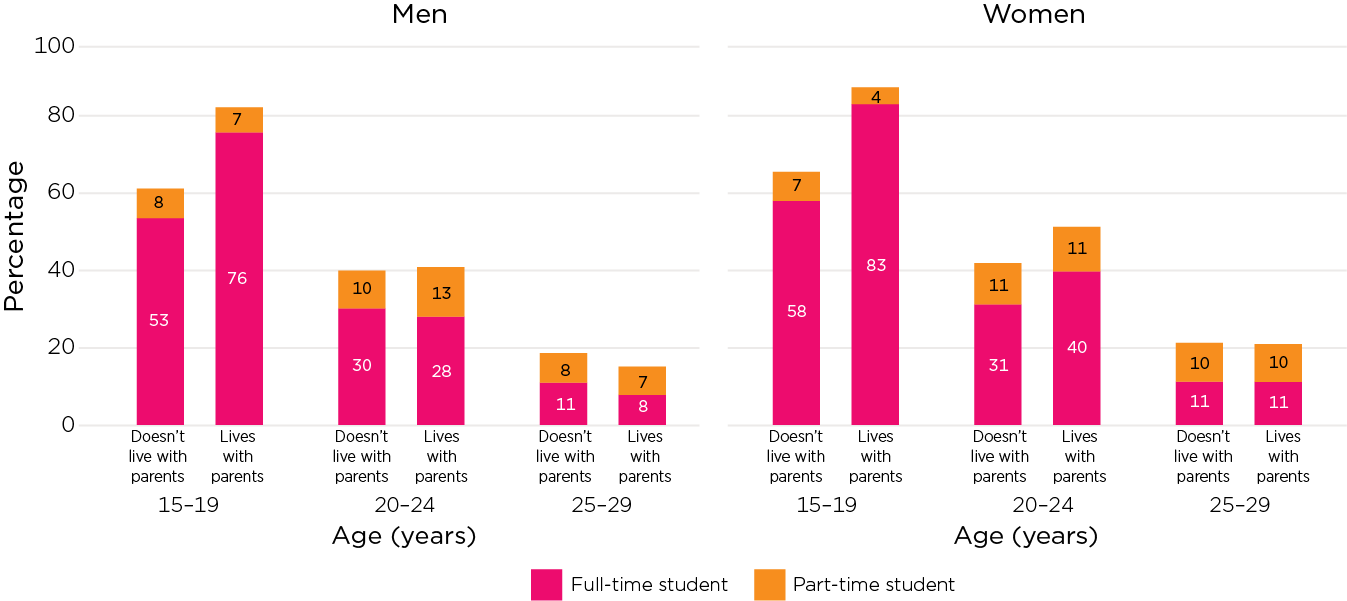
Notes: The columns add to the percentage engaged in study, with the balance being those reporting to be not engaged in study. ‘Studying’ includes secondary, tertiary and vocational education and training providers (e.g. TAFE and private training providers). Those with missing information on engagement in study or whether the study was full-time or part-time were excluded from calculations.
Source: ABS 2021 Census TableBuilder
Employment patterns varied by age and sex
A significant transition for most young people is entering employment, either during or after the completion of education. Figure 8 shows the increased proportion employed by age in 2021.
Participation in employment will vary with a range of factors, such as educational participation and whether young people – especially women – have become parents (see New relationships and children below for proportions of women having had a first child). The differences in employment by age and sex were more prominent than the differences by whether living with parents; although for men, the proportion employed was somewhat lower for those living with parents compared to those who were not across the ages of 15 to 29 years.
Differences were not as apparent for women.
- At 15–19 years, those living away from parents were more likely to be employed, which was mostly related to the higher proportion employed full-time.
- At 20–24 years also, those living away from parents more often worked full-time. The proportion working part-time remained high in both groups, especially those living with parents.
- At 25–29 years, there were markedly higher rates of full-time work, especially for men who were not living with parents (61% worked full-time).
Figure 8: Employment patterns varied by age and sex
Percentage of men and women employed part-time or full-time by age group and whether living with parents, 2021
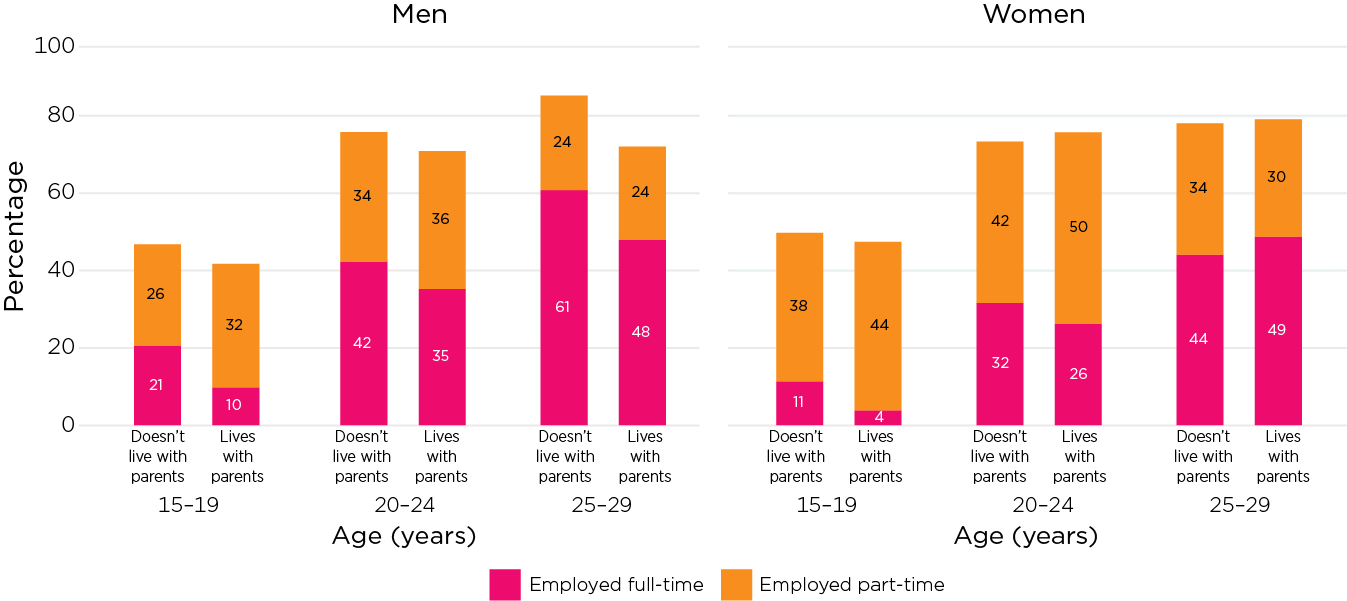
Notes: The height of each column is the total percentage employed, with those working zero hours included in part-time work. The balance is those classified as unemployed or not in the labour force. Excludes those with not stated labour force status.
Source: ABS 2021 Census TableBuilder
Those living with parents had lower incomes
The transition into employment and subsequent progression through the labour market is often associated with improvements in income. This is apparent in Figure 9, in which personal income from the 2021 Census has been grouped into four bands to show increases in income from ages 15–19 years through to 25–29 years for both males and females.
Differences in income for those living with parents compared to those living elsewhere will to some extent reflect that young people will often elect to remain living with parents while their income is low. The availability of income to afford housing will be one of the significant factors in deciding on the timing of leaving the parental home. Figure 9 shows that:
- At 15–19 years, the differences were quite marked, with high proportions of young men and women living with parents in the lower of the income bands presented (80% of men and 84% of women had personal income less than $16,000).
- Incomes were generally higher at 20–24 years, but lower incomes were evident for those living with parents compared to those who were not. Young men aged 20–24 living with their parents were around twice as likely to have a personal income of under $16,000 per year compared to those not living with parents (28% vs 15%).
- At 25–29 years, the differences for men according to whether or not they lived with parents remained significant. Among those living with parents, 37% earned under $34,000 per year compared to just 17% of those who did not live with parents.
- In contrast, at 25–29 years, there was very little difference for women according to whether they lived with parents, with only a 2 percentage point difference (31% vs 33%).
- At this age, there was quite a difference between the incomes of men and women who were not living with parents, with men’s incomes higher. This will relate to some extent to the impacts of fertility, and the changes to employment participation for women that often occur on the birth of children.
Figure 9: Young adults living with parents have lower incomes than those living away
Personal income of men and women by age group and whether living with parents, 2021
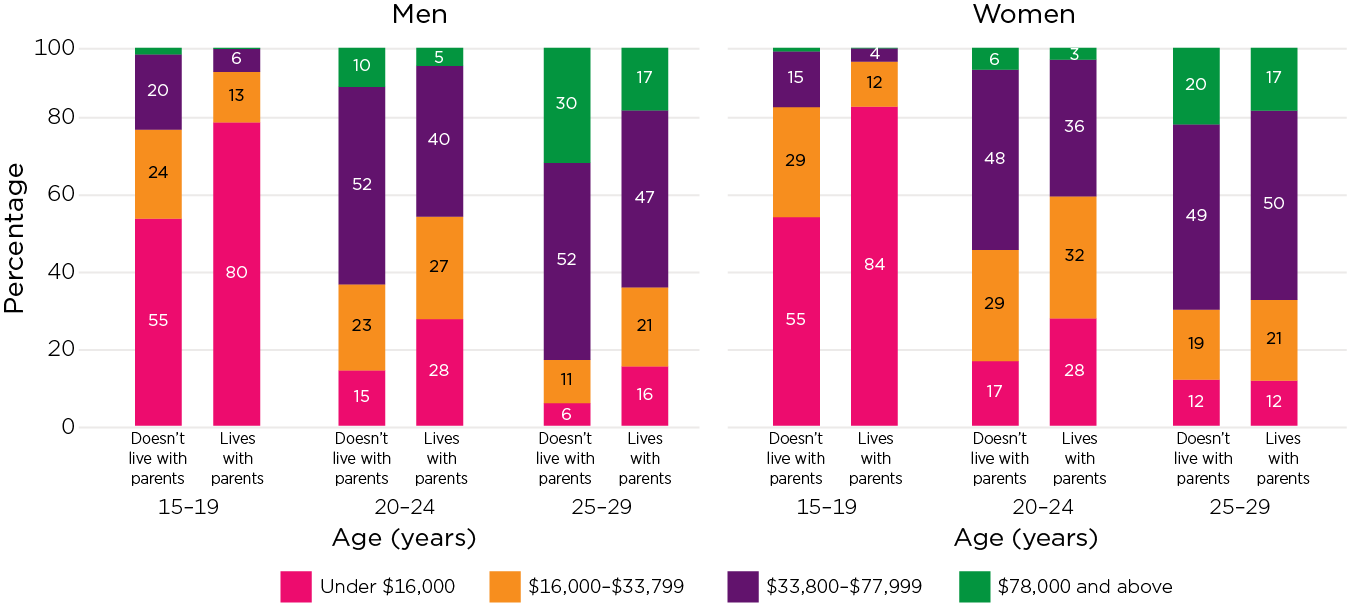
Note: Persons with not stated income were excluded from calculations.
Source: ABS 2021 Census TableBuilder
Young adults, especially women, living with parents more likely to be carers
Carers Australia has identified that there are more than 235,000 carers aged up to 25 years in Australia. This will include those under the age of 15 (unlike the Census data that are for 15 years and over). Carers Australia note that, ‘many young carers emphasise that caring is a positive experience. However, research clearly indicates that, when inadequately supported, young carer’s health, mental health and wellbeing can be seriously affected.’ 10
Data on young carers is reported here using the 2021 Census data on persons who were reported to ‘provide unpaid care, help or assistance to family members or others due to a disability, a long-term health condition or problems related to old age.’
- Young men and women who were living with their parents were more likely to be carers, compared to those not living with parents. Across all 15–29 year olds, 6% of those living with their parents provided care compared to 5% of those not living with their parents. However, there were gendered patterns to this, as women were more often carers regardless of whether living with parents.
- Among men, 5.7% of those living with parents were carers compared to 4.5% of those who were not living with parents.
- Among women, 7.0% of those living with parents were carers, compared to 6.7% of those not living with parents.
- Across the 15–29 years age group, women who lived with their parents were more likely than men who lived with parents to provide care, help or assistance (7% vs 5%).
Figure 10 shows the proportions by age, gender and whether living with parents.
- The gendered differences in the proportion of young carers among those living with parents increased with age. For example, 11% of women aged 25–29 years and living with parents were carers compared to 8% of men living with parents.
- By age group, the gender differences in the overall statistics were also notable for those who did not live with their parents. Young women increasingly provided unpaid care with age even when living away from their parents. For women not living with parents, the proportion of carers increased by 2 percentage points from 15–19 years to 25–29 years. This increase was not apparent for young men.
Figure 10: Young people in their twenties are more likely to be carers if living with parents
Percentage of men and women who were carers by age group and whether living with parents, 2021
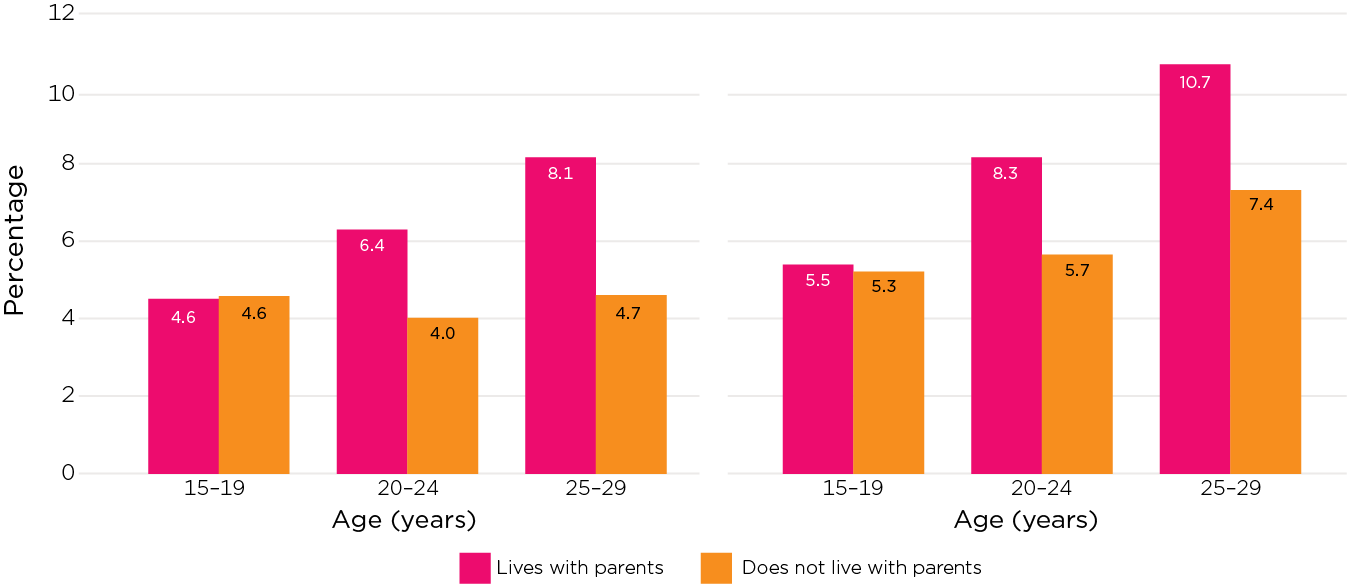
Notes: Excludes those with missing (not stated) information about providing unpaid care. The unpaid care question asks about unpaid care, help or assistance to family members or others in household due to a disability, a long-term condition or problems related to old age.
Source: ABS 2021 Census TableBuilder
7 The census relationship in household classification does not perfectly capture all relationships in a household when there are multiple generations and multiple relationships in the household. As this may be especially problematic in reporting about young people who are living with parents who also have a co-resident partner, the tabulation by whether living with parents is not shown. These relationship data exclude visitors and those living in non-private dwellings.
8 Overseas visitors and people living in non-private dwellings were excluded when deriving the proportion of young people living with a partner. The proportion of young people who were living in non-private dwellings in the 2021 Census was 9% for 15–19 year olds, 12% for 20–24 year olds, and 11% for 25–29 year olds.
9 When deriving the percentages, overseas visitors and women who did not state the number of children ever had were excluded. The proportion of women who did not state the number of children ever had was 9% for women aged 15–19 and 20–24 years, 8% for women aged 25–29 years.
10 www.carersaustralia.com.au/about-carers/young-carers Retrieved 24 March 2023.
Summary
The proportion of young people living at home with parents increased from 2006 to 2021, with increases especially apparent for the late teen years and early twenties. With these census data collected in 2021, during the COVID pandemic, young peoples’ decisions about living in the parental home may have been influenced by ongoing restrictions and labour market conditions (Evans & Prattley [AIFS], 2023; Hand and colleagues [AIFS], 2020), and so might explain some of the larger increases in the proportion living with parents between 2016 and 2021.
This analysis highlighted some socio-economic, cultural and health-related factors associated with the patterns of living with parents. The high rates of full-time study and low income at younger ages is likely to be a deterrent to young people’s leaving the parental home to live independently. Socio-economic factors are likely to affect young people’s decisions across Australia, particularly at a time when it is difficult for young people to find employment and alternate affordable housing is not always available.
Being able to live with parents is likely a key factor in addressing wellbeing in these circumstances, although will not be an option available to all young people. To what extent living (or not living) with parents is a choice or a result of other constraints is not apparent from these data. Exploring these issues further, taking account of factors such as gender, disability, culture and region, is important in considering the best ways to support young people and their families through these years of young adulthood.
References
- Australian Bureau of Statistics (Various Years). Census of Population and Housing, counting persons, place of enumeration [Census TableBuilder], accessed January–March 2023.
- Australian Bureau of Statistics. (Jul2021-Jun2026). Greater Capital City Statistical Areas. ABS. https://www.abs.gov.au/statistics/standards/australian-statistical-geography-standard-asgs-edition-3/jul2021-jun2026/main-structure-and-greater-capital-city-statistical-areas/greater-capital-city-statistical-areas.
- Evans-Whipp, T., & Prattley, J. (2023). Young adults returning to live with parents during the COVID-19 pandemic (Growing Up in Australia Snapshot Series – Issue 8). Melbourne: Australian Institute of Family Studies.
- Hand, K., Baxter, J., Carroll, M., & Budinski, M. (2020). Families in Australia Survey: Life during COVID-19. Report no. 1: Early findings. Melbourne: Australian Institute of Family Studies.
- Morphy, F. (2007). Uncontained subjects: Population and household in remote Aboriginal Australia. Journal of Population Research, 24(2), 163–184.
- van den Berg, L., Kalmijn, M., & Leopold, T. (2021). Explaining cross-national differences in leaving home. Population, Space and Place, 27( 8), e2476. doi.org/10.1002/psp.2476
- Vij, A., Ardeshiri, A., Li, T., Beer, A., & Crommelin, L. (2022). Understanding what attracts new residents to smaller cities. (AHURI Final Report No. 375). Melbourne: Australian Housing and Urban Research Institute Limited. Retrieved from www.ahuri.edu.au/research/final-reports/375, doi: 10.18408/ahuri3226201
- Wilkins, R., & Vera-Toscano, E. (2019) Over 50% of young Australian adults still live with their parents – and the numbers are climbing faster for women. The Conversation, 30 July. Retrieved from theconversation.com/over-50-of-young-australian-adults-still-live-with-their-parents-and-the-numbers-are-climbing-faster-for-women-120587
© GettyImages/Angelo Varela