Parental Leave Pay and Dad and Partner Pay: Patterns of use
Analysis using the Person Level Integrated Dataset (PLIDA)
December 2023
Download Research report
Overview
This research report explores how the Australian Government's Parental Leave Pay (PLP) and Dad and Partner Pay (DAPP) were used by families up to December 2022. As well as providing an overview of recipient numbers, it provides insights on which families were using PLP and DAPP and how they were using it, highlighting which families are most likely to be using these payments straight after the birth. For example, young mothers and mothers with lower levels of educational attainment are most likely to be using PLP early, suggesting a lack of access to employer-funded leave, and affirming the value of PLP in supporting these mothers' connection to employment. This research report is the first output from the project 'Statistical profile of use of Paid Parental Leave and Dad and Partner Pay', using the Person Level Integrated Data Asset (PLIDA), previously named MADIP (Multi Agency Data Integration Project). The project explores the use of PLP and DAPP making use of linked data in PLIDA. The primary data source is administrative data from the Department of Social Services (DSS) resource 'Data Over Multiple Individual Occurrences' (DOMINO), with DOMINO tables stored in PLIDA. These data have been linked to data from the ABS Census of Population and Housing (Census) and other administrative data. The analysis of linked Census data shows that at a point in time (on Census night) about one in five mothers of a child under one year of age were using PLP, with there being distinct patterns in use in the months following the birth. For DAPP recipients, this number as a percentage of new fathers is much lower, at about one per cent. The report also includes analysis of how PLP and DAPP are used, about timing of use, and how PLP and DAPP are sequenced in couples where both are taken. Finally, some analysis shows the extent of other kinds of financial support received by families in this period after the birth of a child, focusing on DSS-administered government income support payments, benefits and allowances.
1 Introduction
This research report is the first output from the project 'Statistical profile of use of Paid Parental Leave and Dad and Partner Pay', using the Person Level Integrated Data Asset (PLIDA), previously named MADIP (Multi Agency Data Integration Project). The project explores the use of the Australian Government's Parental Leave Pay (PLP) and Dad and Partner Pay (DAPP), making use of linked data in PLIDA.
This is the first piece of comprehensive research that documents the use of PLP and DAPP since the Australian Government Department of Social Services (DSS) 2015 report of the review of the Paid Parental Leave Scheme and the Paid Parental Leave scheme final evaluation report (Martin, Baird, Brady et al., 2015). The analysis here extends and updates the administrative data analysis that was presented in that report. While regular DSS reporting provides some key demographic information on PLP and DAPP recipients,1 there is no information that delves into the ways in which these payments are used, and how use varies across different families. The lack of current information on PLP/DAPP was recently noted by Baird (2021), whose article highlighted the value of data in the ongoing consideration of this policy area.
With changes to PLP and DAPP having started in 2023 and expected to roll out over coming years, this report provides some contextual information on how these payments are used under the scheme to date. For more information on these reforms see Boosting Parental Leave to Enhance Economic Security, Support and Flexibility for Australia's Families (dss.gov.au). A summary is provided in section 2.2 below.
The report shows how PLP and DAPP has been used up to December 2022, under the pre-Reform scheme, and how it varies across different kinds of families. The focus is on three broad research questions:
- What are the characteristics of PLP and DAPP recipients, and have these characteristics changed since the schemes' introductions?
- How are families using PLP and DAPP - what can be said about the timing of use and how it varies in different families?
- To what extent is PLP (and DAPP) used across all families with children under one year of age, and if not PLP, what other financial supports are they accessing?
The primary data source is administrative data from the DSS resource 'Data Over Multiple Individual Occurrences' (DOMINO), with DOMINO tables stored in PLIDA. In PLIDA, these data can be linked to Census and other administrative data. Additional research uses the Census data, and using Census data linked with DOMINO, to report on families with a child under one year of age, and their use of PLP, DAPP and some other DSS-administered government payments. A second report will extend this research, making more use of the linked Census-DOMINO data. More information about the data is provided in the Data section below.
This research does not explore the use of employer-funded parental leave, given information on this is not available in the PLIDA datasets. The availability of this leave is no doubt relevant to families' use of Government-funded PLP and DAPP, and links between parents' job characteristics and PLP use will be a focus of a second report. The background section below includes some contextual information about parental employment and leave.
1 Information about PLP and DAPP is available through DSS regular reporting on all payments and programs. This includes annual reports and quarterly statistics DSS Benefit and Payment Recipient Demographics - quarterly data - Dataset - data.gov.au
2 Background
2.1 Family composition
The focus of this report is on families with children under one year of age and includes some analysis of single and couple parent families, and reference to opposite-sex and same-sex couple families. By way of background, it is useful to note that the vast majority of children under one year of age live with both parents. Qu and Baxter showed that at the 2021 Census, 82% of children under one years old lived in an intact family (with both biological/adoptive parents), 8% lived in a stepfamily or blended family, and 10% lived with a single parent (see Qu & Baxter, 2023a). While the number of same-sex couple families is increasing (see Qu & Baxter, 2023a, using census data), the incidence among new parents is expected to be very low. In 2021, of all couple families only 1.4% were same-sex couples. Family composition of PPL and DAPP recipients will be explored in this report.
2.2 Parental employment and leave
Mothers and fathers and employment
Recent AIFS analysis of Census data shows continuing gendered patterns of employment among parents of young children, with fathers likely to continue in full-time employment when children are young, and mothers likely to reduce engagement in paid work. In 2021, for example, within couple families with a child under one year of age, in 24% both mother and father were employed and working more than zero hours, in 61% only the father was working more than zero hours, in 2% only the mother was working more than zero hours and in 13% neither parent was employed or at work.
While 'zero hours' includes mothers (or fathers) in casual employment who were without work in the reference period for the Census, it is very likely that for mothers with newborns, this category largely reflects mothers who are on leave from employment.
This analysis showed, for mothers with a child under one year of age, marked increases over recent decades in the percentage who were employed. The increase, though, was almost entirely explained by the growth in the percentage of employed mothers working zero hours. Between 1991 and 2021, the percentage employed mothers increased from 30% to 57%, and within that, the percentage employed but working zero hours increased from 5% to 32%.
Access to maternity leave or parental leave, that allows mothers to remain connected to employment while taking a break to care for newborns, is important in facilitating this ability to be employed but working zero hours. Access to paid leave is especially useful, which is an important contribution of Paid Parental Leave.
Workplace perspectives - overview
Paid Parental Leave and Dad and Partner Pay are both options for eligible parents, allowing them to extend leave conditions that may be offered by their employer. The availability of these payments is especially important for self-employed and casual workers, or other workers without leave entitlements. This report does not include workplace characteristics in its examination of PLP and DAPP use, but the availability of employer-provided parental leave (in part of the labour force) is discussed below, for some context.
For a broader perspective on the availability of leave in the public sector, the June 2023 Maternity Leave Act review report presents useful summaries.
Workplace perspectives - private sector
Employer-level data about parental leave provisions is reported by the Workplace Gender Equality Agency (WGEA), using data on non-public sector employers with more than 100 employees. In the WGEA Gender Equality Scorecard covering 2021-22, it was reported that 62% of employers offered paid primary carer's leave (either to both women and men or to women only), with this leave at least partially funded by the employer. While the proportion has increased slowly year on year, it has increased markedly over a longer time. For example, in 2013-14, 48% of employers offered paid primary carer's leave.
There is considerable variation across the labour market in the availability of paid parental leave. Small employers are less likely to offer paid primary carer's leave. For example, in 2021-22, among those employing less than 250 people, 44% offered no paid primary carer's leave. At the other end of the scale, 14% of those with 5,000 or more employees offered no paid primary carer's leave.
Similarly, there are marked differences by industry of employment, noting the scope is non-public sector employers with more than 100 employees. For example, in 2021-22:
- Access to paid primary carer's leave was most likely in industries of Education and Training (87%), Electricity, Gas, Water and Waste Services (87%), and Financial and Insurance Services (86%).
- Access to paid primary carer's leave was least likely in industries of Accommodation and Food Services (36%), Retail Trade (36%), Administrative and Support Services (35%) and Public Administration and Safety (26%).
The majority (92%) of employers make the primary carer's leave accessible to men and women with only 8% of employers providing primary carer's leave to women only in 2021-22. There is, however, a very gendered pattern to the use of primary carer's leave, with 87% of primary carer's leave taken by women in 2021-22. Among non-managers it is 88% and managers 76%. WGEA reports that there has been some increase in the proportion of men taking the primary carer's leave.
Some employers are aiming to improve the gender balance in parental leave use, and to make more equitable access to leave for varied family circumstances. They are removing the reference to 'primary' or 'secondary' carer status, or gender, and offering equal amounts of leave to all new parents or caregivers. Of employers offering paid parental leave in 2021-22, 24% had a gender-neutral approach, without a primary/secondary carer distinction.
Within the data held by WGEA, most employers (84% in 2021-22) fully paid for the employee's salary for the period of paid parental leave. The balance includes 10% that paid the gap between the salary and the pay from the government's Paid Parental Leave scheme, and 6% that paid the leave amount in a lump sum.
At 2020-21 the average length of primary carer's leave was 11.1 weeks. Underlying these averages, 14% of employers offered 1-6 weeks, 24% offered 7-12 weeks, 16% offered 13-17 weeks, and 7% offered 18 weeks or more. In contrast, the average length of secondary carer's leave was 2.3 weeks in 2020-21.
Evaluation findings about PLP and job retention
The evaluation of the Paid Parental Leave scheme considered a number of outcomes of the scheme, one of them being how it had impacted mothers' return to work timing and job retention. Their analysis showed that the introduction of PLP was associated with a lesser proportion of mothers being back at work in the early months after a birth, but that by 6 months after the birth, the introduction of PLP saw a small rise in the proportion of mothers at work. That is, PLP provided an opportunity for mothers to be at home for longer, while remaining connected to employment. This impact was most marked for low-income mothers and mothers who were self-employed or in casual jobs before the birth. These findings were consistent with expectations and the objects of the policy. Impacts on employment were less apparent for high income women, which was attributed to the wage replacement of PLP (at minimum wage) being low relative to usual income for these women, and these women also being more likely to have access to paid leave through their employer.
Given these findings, it is expected that use of PLP in the early months after the birth will be most apparent among low-income mothers and mothers without access to employer-provided parental leave.
Evaluation findings about DAPP
DAPP was evaluated as part of the evaluation of the Paid Parental scheme (see Martin et al., 2015). Findings suggested that the introduction of DAPP altered how fathers took leave after the birth, with the potential to access DAPP while on unpaid leave meaning some fathers chose this option rather than using their paid annual leave after the birth. The introduction of DAPP did not see an increase in the proportion of fathers taking leave after the birth, but slightly increased the average length of leave taken. In summarising the findings for the evaluation of DAPP, Martin et al. (2015) noted that the categories of fathers that benefited substantially from DAPP were 'Fathers who previously had no access to paid leave following a birth, particularly employees on casual contracts, contractors and sole traders' and 'Fathers who had exhausted other paid leave (especially annual leave) and had high family support demands that could not be met in other ways'.
2.3 Australian policy content - PLP and DAPP
Parental Leave Pay
The Australian Government's Paid Parental Leave scheme commenced in 2011, being available to eligible parents with birth or adoption dates from 1 January 2011. Parental Leave Pay(PLP) is a payment under the Paid Parental Leave Act 2010. PLP is not a leave entitlement, although it sits alongside the unpaid parental leave provisions under the Fair Work Act 2009. More detailed information about the scheme and other provisions can be found in Baird, Baxter and Hamilton (2023).
The scheme (to June 2023) provides up to 18 weeks of pay to eligible working parents at the rate of the national minimum wage. At March 2023 the rate of payment was $812.45 per week (before tax). PLP recipients may negotiate with their employer to top up this amount to bring their income back to the usual amount without this impacting their PLP payment.
Typically, the recipient is the mother. The eligibility conditions require recipients to be the primary carer of a newborn or adopted child, and one of the following:
- the birth mother of a newborn child
- the initial primary carer of an adopted child placed in your care by an authorised party for the purpose of adoption
- another person caring for a child under exceptional circumstances
- someone to whom the previous primary carer has transferred some or all of their Parental Leave Pay.
As indicated in the above, all or some of the PLP can be transferred from the mother to another primary carer, such as the child's father or the PLP recipient's partner. This second recipient would also need to meet eligibility criteria.2
Eligibility to PLP is based on an income test and work test (see Box 1 below), as well as being subject to residency requirements. (Note that this report reflects the Paid Parental Leave scheme, including eligibility rules that applied before the changes on 1 July 2023).
Box 1: Income and work test
The income test is based on the applicant's individual income in the year prior to the birth or adoption. It uses adjusted taxable income. If the 2021-22 financial year income was assessed, to be eligible the adjusted taxable income had to be $156,647 or less.3 If the 2020-2021 financial year income was assessed the limit was $151,350, for 2019-20 and earlier years the limit was $150,000.
The work test requires recipients to have worked at least 10 of the 13 months before the birth or adoption, involving at least 330 hours of paid work, without a break in employment of more than 12 weeks. Paid leave counted as work and from 1 March 2014, periods of PLP and DAPP within the 13-month window counted toward the work test. As parents' work was often disrupted during the COVID-19 pandemic, periods on JobKeeper Payment or the COVID-19 Disaster Payment also counted toward the work test.
PLP can be taken at any time (in one block) up until the child's first birthday, although with the introduction of Flexible Paid Parental Leave in 2020 (described below), a portion of it may be used flexibly and taken any time up to the child's second birthday.4 PLP can be taken while also receiving leave entitlements (including paid leave) from the recipients' employer. New parents may instead choose to use the PLP once the paid leave from their employment concludes. As PLP is a payment, rather than guaranteed leave, the timing of leave-taking and return to work needs to be negotiated with employers.
Dad and Partner Pay
Dad and Partner Pay (DAPP) was introduced in 2013, providing two weeks at the national minimum wage rate for eligible fathers and partners. This applied to those who cared for a child born or adopted from 1 January 2013. As for PLP, the DAPP rate was $812.45 per week (before tax) at March 2023. DAPP recipients may negotiate with their employer to top up this amount to bring their income back to the usual amount without this impacting their DAPP payment.
DAPP is to be taken in the year after the child's birth and can only be taken while on unpaid leave. DAPP cannot be transferred to the mother.
Eligibility is subject to the same income test and work test that applies to PLP (see Box 1). Eligibility is also subject to residence rules and requires that fathers care for the child on each day of the DAPP period.
Flexible Paid Parental Leave
From July 2020, families have had the option of taking the first 12 weeks of PPL in a continuous block, then using the final six weeks as Flexible Paid Parental Leave (FPPL), including using it to return to work part-time by using the leave on a part-time basis, or sharing the leave with someone else. The first 12 weeks needed to be taken before the child's first birthday, and the remaining 6 weeks could be taken any time after using up the first 12 weeks until the child's second birthday.
Changes 2023 and beyond
Changes to the Paid Parental Leave scheme were introduced from 1 July 2023 with more changes expected to be rolled out in subsequent years. The key changes in July 2023 are described below:
- The removal of DAPP as a separate payment, with PLP now designed for sharing between parents. PLP was extended to 20 weeks to include the 2 weeks previously covered by DAPP. This is equivalent to a total of 100 days of PLP.
- Within couples, each parent can use at most 90 of the 100 days, with the remaining 10 days reserved to share with the other parent if they are eligible. That is, if the birth mother is eligible for PLP, she can choose to share the 100 days of PLP, but if she has a partner and she elects to use it all herself she cannot use more than 90 days.
- Single parents can access the full 100 days if they choose not to share the PLP with another parent.
- Each parent can take up to 10 days of the PLP at the same time.
- Partners can only access a share of PLP if they themselves are eligible and the birth parent meets the work test. That is, fathers cannot access a share of PLP if mothers have not met the work test for PLP.
- A family income test was introduced, so that if parents are ineligible for PLP because their income is above the personal income cutoff ($168,865 in 2022-23 and $156,647 in 2021-22) they can access it if their family income (e.g., birth parent income plus partner income) is less than a higher cutoff ($350,000). This family income test can also be applied if the claimant is a single parent.
- Parents can take PLP while on paid or unpaid leave from work. This was previously the case for PLP, but not for DAPP, for which fathers could not be on paid leave.
For more up-to-date and detailed eligibility information as well as specifics relating to adoptions, sharing care with people other than parents, and special circumstances refer to the Services Australia website.5
This report includes data up to December 2022, so does not cover the impacts of these changes. This research will provide context to these changes, with later analysis able to consider how the 2023 (and beyond) changes are accompanied by changes in use. The final section of the report includes a subsection that summarises how the findings presented here might be different under the new arrangements.
Alternative and supplementary payments
PLP and DAPP are intended to provide financial assistance to parents who are taking leave from employment to care for a newborn or a newly adopted child. They are therefore relevant to those in employment and, as noted previously, are subject to a work test and income test. There are alternative and supplementary payments and allowances available to families who do not meet these requirements. The availability of these financial supports has varied over the period covered in this report. Refer to the PLP and other DSS payments section for a summary and brief analysis of the coverage, focusing on DSS payments (that is, government payments, allowances and benefits administered by DSS).
2 A criticism of these eligibility conditions was that for the PLP to be transferred to someone else (say, the father), the mother had first to be eligible. So in cases where the father was the low income earner, he may have been precluded from accessing PLP if the mother's income exceeded the income threshold. The July 2023 changes introduced a family income test that assesses eligibility at a second stage for those failing on the individual income test.
3 The income test is based on 'adjusted taxable income'. This includes taxable income from sources like wages and salaries, business and investment. It also includes some pensions and benefits, although payments not included are Family Tax Benefit and Child Care Subsidy.
4 The focus of this report is on the first year after the birth, as the analysis shows that by the child's first birthday, only a small proportion of parents are using PLP.
5 See Who can get Parental Leave Pay for a child born or adopted from 1 July 2023 - Parental Leave Pay for a child born or adopted from 1 July 2023 - Services Australia
3 Data and method
3.1 Data
DOMINO data
This research is a PLIDA project, drawing on administrative data about PLP and DAPP, about the recipients of these payments and their characteristics. The administrative data about these payments comes from the DSS resource 'Data Over Multiple Individual Occurrences' (DOMINO), with DOMINO tables stored in PLIDA, and able to be linked to Census and other data. For this report the scope was limited to anyone starting PLP or DAPP before January 2023.6
For analysis from DOMINO, all recipients of PLP and DAPP since the commencement of each payment were in scope for this research. Characteristics of recipients, families and children were extracted and linked from different tables in DOMINO and compiled into one analytical dataset. From the DOMINO data, information was extracted on gender, age, whether Aboriginal and/or Torres Strait Islander, country of birth (presented here as whether Australian-born), relationship status (and gender of partner if applicable) and child month and year of birth.7 Some family variables were derived: the number of children born prior to the one for whom PLP or DAPP is being used, and whether the 'PLP/DAPP' child is one of a multiple birth, for example.8
Some information was accessed from other linked data.
- The 'combined location' data in PLIDA was used to identify which State they were located in and the remoteness at commencement of payment. This information was only current to June 2021, so was missing for many newer PLP/DAPP recipients.9
- The 'combined demographics' information in PLIDA was used for whether Aboriginal and/or Torres Strait Islander. This information was only current to June 2021, so was missing for many newer PLP/DAPP recipients. The DOMINO measure was used where this information was missing from the combined demographics data.
- Income data was derived from the ATO data, using the financial year total profit and loss amount variable. It was matched by individuals' identification variables to all recipients of PLP and DAPP. Data for the financial year before the PLP/DAPP commencement was matched for the purposes of analysis reported here.10
The file that was created from the above information contains all episodes of PLP and DAPP payments since the schemes' commencement. Each row largely reflects the total amount of PLP or DAPP used for one child, but in a small number of cases the PLP payment has been split across different recipients. The data are further manipulated to report couple-level and family-level data, all achieved by reformatting the data to different units of measurement. Some of the later child-level analysis present the data in more detail, looking at timing of access by exploring the data at a monthly level for each child.
- There were over 2.75 million records in the final analytical dataset, relating to all PLP and DAPP episodes.
- The child-level dataset contained about 2.1 million records. This is fewer than the number of PLP/DAPP records as there could be multiple PLP/DAPP records per child. Typically, there was one or two records per child but in rare cases there was more.
For detailed analysis of PLP and DAPP, the DOMINO data are entirely based on recipients of PLP and DAPP and the children the payment related to, so they do not provide insights on families that received neither of these payments. DOMINO data are also used for analysis of a broader population of families, in analysis of linked Census and DOMINO data, described below.
Census data
PLIDA includes unit record data for all individuals and families for the 2016 and 2021 Censuses. These datasets were accessed to identify children aged under one year at the time of each Census11, and to attach parental and family information to those records. This was appropriate for analysis related to PLP and DAPP for births before 1 July 2020, with leave entitlements needing to be used prior to the child's first birthday (or anniversary of adoption). For births or adoptions after July 2020, PLP may be used for children up to their second birthday (or adoption anniversary), but it is nevertheless expected that a focus on children aged under one year will capture the main population of potential PLP users.
This report draws on the Census data to describe the characteristics of families with a child under one year of age, including information on parents' employment, education, cultural diversity, age, location and so on.
- In 2016 there were 249,471 families with a child under one year of age, including 248,547 female parents and 220,370 male parents.
- In 2021 there were 268,881 families with a child under one year of age, including 267,512 female parents and 238,099 male parents.
Census-DOMINO linked data
Further analysis uses a derived file in which the Census and DOMINO data were linked. A key element of this was restricting DOMINO information to focus on receipt of DSS payments on Census night (2016 or 2021).12 This was done at the parent level, i.e., determining what payments the mothers and fathers of a child under one year of age were recorded as receiving at this time. Flags were derived that identified whether parents were receiving PLP or DAPP, or other kinds of DSS payments, at the time of the Census. Some analysis in the Appendix explores the correspondence between employment, as captured in the Census, and payment receipt from DOMINO.
The linked data were used to describe the characteristics of PLP/DAPP recipients, particularly for Census variables not available in DOMINO. A key variable available in the Census data was child age in months, and some preliminary analysis using this variable, along with the linked data, is presented in this research. As with the DOMINO data, child age in months at the Census is based on child year and month of birth, so is not an exact calculation. Access to Census-collected information about employment is especially relevant, but this will be the focus of a subsequent report.
3.2 Method
Much of the analysis presented is descriptive, drawing on the above datasets to examine:
- Characteristics of those using PLP or DAPP, comparing over time. At the broadest level, these characteristics are compared to characteristics of all families with a child under one year of age.
- Patterns of use of PLP and DAPP, including the timing of start and the number of weeks accessed overall, by financial year, and by selected demographics.
- Family and child-level analysis of timing and concurrent use of PLP and DAPP.
- How families are supported by payments other than PLP/DAPP across the first year of a child's life.
Some multivariate analysis is used to explore patterns of use of PLP and DAPP. Model results are presented in the Appendix with selected key findings in the main report.
6 The source of the DOMINO data was March 2023 updates but the analytical dataset was restricted by excluding those with a start date after 31 December 2022, with some of the administrative data in the first quarter of 2023 potentially incomplete or subject to change.
7 Using child date of birth in this analysis is problematic for PLP/DAPP recipients with adopted children, for whom date of birth may be earlier than the date of adoption. Numbers affected are expected to be very small. Also, as we only have month/year of birth, derivations and calculations that use date of birth are indicative rather than exact.
8 These derivations assume there is complete data about all children in DOMINO. It may not be the case, particularly for PLP/DAPP users at the beginning of the schemes, if families were not eligible for DSS payments around the birth of older children. Indeed, analysis of family size by financial year indicates data may be incomplete for the earlier financial years, with higher proportions classified as having only one child compared to more recent data.
9 At the time of analysis, this project did not have access to post June 2021 'combined location' and 'combined demographics' data. These 'combined' datasets are created by ABS to make available the best data on location and demographics from across multiple data sources in PLIDA.
10 The ATO data AIFS had access to at the time of analysis were current up to the 2019-20 financial year (and so is used for PLP/DAPP started in 2020-21). That is, income was not available for PLP/DAPP used in 2021-22 or later. When updated data are available, AIFS may repeat the analysis to include the more recent data. Ideally, information on Adjusted Taxable Income would be used, as this is used in determining eligibility for payments. However, this variable was not available on PLIDA. In later analysis, income of partner could also be matched from the ATO data.
11 While the Census aims to enumerate everyone in Australia, there is undercount in some groups. In the 2016 Census, ABS estimates that there was a net undercount of 5.1% for 0-4 year olds (see 2940.0 - Census of Population and Housing: Details of Overcount and Undercount, Australia, 2016 (abs.gov.au)). The undercount for 0-4 year olds was lower in 2021 (1.7%), but this was based on a changed approach compared to 2016 (see 2021 Census overcount and undercount, 2021 (abs.gov.au)) .
4 Overall numbers using PLP/DAPP
4.1 Recipient numbers from DOMINO
Counts of PLP recipients and DAPP recipients are shown in Table 1. Estimates from PLIDA are presented according to the financial year in which the period of payment commenced. The PLIDA estimates differ slightly to those published in DSS annual reports (also shown), likely explained by the different timing of accessing the administrative data and different methods used to define the population.
The number using PLP trended upwards in the early years of its introduction and has generally remained around 170,000 recipients in more recent years. This compares, for example, to 309,996 births in 2021, as reported in Qu and Baxter (2023b). To some extent the difference between these two numbers reflects that some new mothers have no recent connection to employment, meaning they are not eligible for PLP but may instead be eligible for other forms of support (see PLP and other DSS payments section).
| Financial year payment started | PLP | DAPP | DAPP as % of PLP | Children supported by PLP or DAPPd | ||
|---|---|---|---|---|---|---|
| From PLIDAb | DSS Reportsc | From PLIDAb | DSS Reportsc | From PLIDA | From PLIDA | |
| 2010-11 | 47,679 | 43,000 | -- | -- | -- | 47,572 |
| 2011-12 | 126,168 | 124,397 | -- | -- | -- | 125,693 |
| 2012-13 | 132,436 | 130,623 | 33,189 | 26,212 | 51.4 | 148,388 |
| 2013-14 | 147,881 | 144,255 | 76,071 | 72,975 | 45.3 | 169,145 |
| 2014-15 | 161,827 | 158,974 | 73,290 | 70,785 | 46.6 | 179,314 |
| 2015-16 | 168,714 | 170,501 | 78,601 | 79,126 | 48.8 | 187,311 |
| 2016-17 | 169,227 | 170,925 | 82,540 | 83,600 | 50.6 | 188,348 |
| 2017-18 | 166,118 | 159,372 | 84,117 | 81,882 | 52.0 | 186,307 |
| 2018-19 | 171,690 | 178,758 | 89,253 | 91,762 | 53.0 | 191,825 |
| 2019-20 | 169,807 | 171,712 | 90,061 | 92,343 | 53.3 | 189,014 |
| 2020-21 | 173,067 | 169,029 | 92,307 | 89,784 | 54.3 | 194,237 |
| 2021-22 | 183,424 | 178,778 | 99,560 | 97,863 | 51.4 | 202,983 |
| 2022-23a | 89,261 | 45,247 | 50.7 | |||
Note: aExcludes payments started after December 2022. bThe PLIDA count is the number with a start date in the financial year. cDSS reports count recipients who started receiving payments in the financial year. DSS figures for 2017-18 and 2018-19 were impacted by processing delays that occurred in the 2017-18 entitlement year. dChildren are classified by the first start date of parents' PLP or DAPP use.
Source: PLIDA analysis and DSS/FaHCSIA Annual Reports. PLIDA extract based on March 2023 data release.
In each year, the number of DAPP recipients is about half the number of PLP recipients. The number using DAPP has also trended upwards since its introduction.
The number of children supported by either PLP or DAPP each financial year is also shown in Table 1, being higher than the PLP number from 2012-13 as children may be supported by fathers taking DAPP even when mothers do not take PLP (later analysis will explore this).
4.2 Numbers and proportions at Census
Overall percentages
Using the linked Census-DOMINO data that focuses on families with a child under one year of age at the time of each Census:
- Of mothers of a child under one year of age in 2016, 48,733 (19%) were receiving PLP. Of the fathers, 2,078 (1%) were receiving DAPP, and a much smaller number were receiving PLP (129, 0.1%).
- Of mothers of a child under one year of age in 2021, 57,548 (22%) were receiving PLP. Of the fathers, 2,420 (1%) were receiving DAPP, and a much smaller number receiving PLP (473, 0.2%).
The much lower percentage for fathers compared to mothers to some extent reflects the lower likelihood of detecting fathers on DAPP with a duration of 2 weeks relative to the 18 weeks for mothers.
These linked data are, of course, a subset of those receiving PLP or DAPP over the relevant financial years. The identification of 'receiving PLP' (or DAPP) is based on the Census date falling between the start and end date of a period of PLP. From 2020, with the introduction of Flexible Paid Parental Leave, some people had an elapsed time on PLP, between start and end date, of greater than 18 weeks, which appears to be related to their breaking their PLP use into more than one block. Data used to date do not identify receipt, or not within this elapsed time. It is likely that some of those identified as 'receiving PLP' at the time of the Census were between blocks of PLP use, and not receiving PLP at this time, so to adjust for this, those currently on PLP but with an elapsed duration of greater than 18 weeks were reset to be classified as not receiving PLP in the above estimates. While this might undercount those using it at later periods after the child's birth, it avoids the overcounting that would otherwise occur overall. The original unadjusted number was 62,345 (23% of mothers).13
PLP use by age of child in months
An advantage of analysing these data with the linked Census-DOMINO data is that the approximate age of the under-one-year old, in months, is available for all the population.14 Figure 1 shows the proportion of mothers receiving PLP by child age in months, for 2016 and 2021. These statistics are also reported in Appendix Table 1.
In both 2016 and 2021, Figure 1 shows that mothers were most likely to be receiving PLP when their youngest child was 2-4 months old, with 40-44% of mothers receiving PLP at this time. Also, 33% were receiving PLP when their youngest child was up to one month old.
The proportion receiving PLP dips considerably from about the 5th month, and at this time there are some differences between 2016 and 2021 results. In 2016, 17% were receiving PLP at the 5th month, and in 2021 this was 22%, or 20% after excluding those on PLP for more than 18 weeks. By the 9th month, 6% were receiving PLP in 2016 and 10% in 2021, using the adjusted estimate.
The very marked similarity of findings for 2016 and 2021 in the early months suggests there has been little change in the take-up of PLP among mothers wanting to use it straight after a birth. The higher rates for 2021 at later months may indicate that the increase in the proportion using PLP overall relates to mothers who use PLP later, probably after a period of employer-funded leave. As discussed later in the report, this may reflect increasing access to and use of employer funded parental leave by mothers, while there continues to be a proportion of mothers without access to employer funded leave who use PLP immediately after the birth.
Similar statistics were not produced for fathers and DAPP, given the smaller incidence of receipt overall. However, at child age of up to one month, it was estimated that 7% of fathers were receiving DAPP in 2016 and 5% in 2021. Percentages were under one percent for other ages.
Figure 1: PLP use is most likely when children are aged 2-4 months
Proportions of mothers of under one-year olds receiving PLP, by age of youngest child in months, 2016 and 2021
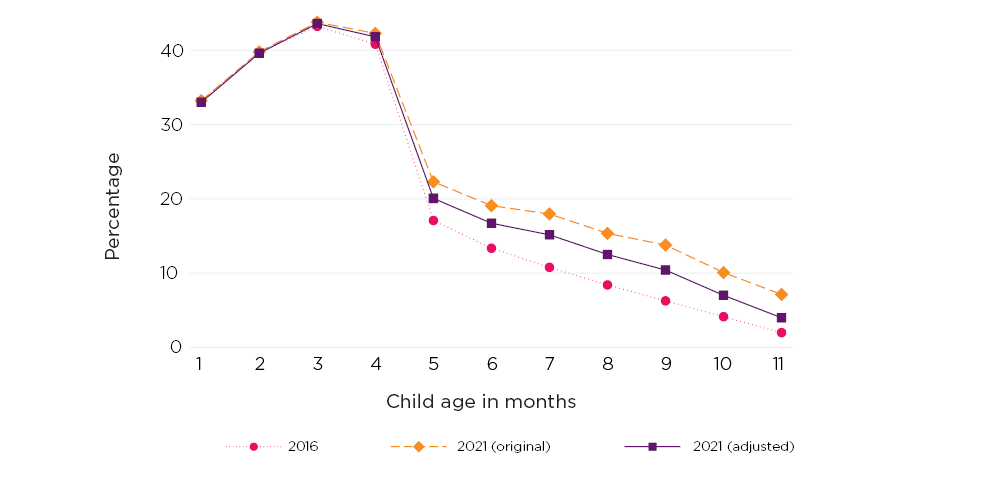
Notes: 2021 data are shown twice, one (original) and the other (adjusted) in which the indicator for PLP receipt for mothers who had been on PLP for more than 18 weeks reset to zero. Child age in months is approximate as it was derived from child birth date set to the first of the month for all children. These statistics are also reported in Appendix Table 1.
Source: PLIDA, DOMINO data update March 2023, linked to 2021 Census.
4.3 Mothers' PLP in context with employment
Before moving on to an examination of which parents are using PLP and DAPP, we briefly put the above PLP information, by child age in months, into a broader context to show how this relates to the patterns of maternal employment that occur in this first year after a birth. Analysis of ABS labour force data by AIFS shows that for mothers of under-one-year olds, there is variation in the degrees of connection to employment within this cohort, and there have been significant changes in recent decades with mothers more likely to be employed, and in particular to be employed but away from work (see Baxter (2023)).).
Figure 2 shows that at the time of the 2021 Census:
- Across all months, around 4 in 10 mothers were not employed - they were unemployed or not in the labour force. Some of these mothers were using PLP. While eligibility for PLP requires mothers to have met a work test, it is possible that some mothers will have resigned or consider themselves to have stopped working, so when asked about employment in the Census, they reported that they did not have a job. This could be especially relevant for mothers who had previously worked in casual and/or short-term jobs, who in fact may have returned to work, but not be working at the time of the Census. The proportions of mothers who were not employed and receiving PLP was less than those of mothers employed and receiving PLP.
- Across all months, about 6 in 10 mothers of under-one-year olds were employed. Few mothers with a child aged under one, two or three months reported being employed and working more than zero hours (around 10%) but this then increased month on month to reach 44% by the time the youngest was 11 months.
- Among mothers employed but working zero hours, some were supported by PLP and some were not. Those not supported by PLP may have been receiving paid leave from their employment (as might those using PLP), but some may have been on an unpaid period of leave.
In deriving these data, mothers working more than zero hours were classified into this one group, rather than separating into those receiving PLP or not. With the introduction of Flexible PLP, it is possible for mothers to have returned to work and be using the PLP to support a part-time return to work. However, this is not examined here, as the administrative data require further analysis to determine whether mothers who had returned to work were concurrently using PLP or were instead banking up PLP for later use. See Appendix Table 2, about 6,000 mothers reported to be working part-time or full-time hours and were also classified as receiving PLP. This is after removing those with elapsed time on PLP of more than 18 weeks.
Figure 2: Employment grows by age in months as PLP receipt declines, but many are not working and not using PLP at younger ages
Employment and PLP among mothers of under one-year olds, by age of youngest child in months, 2021
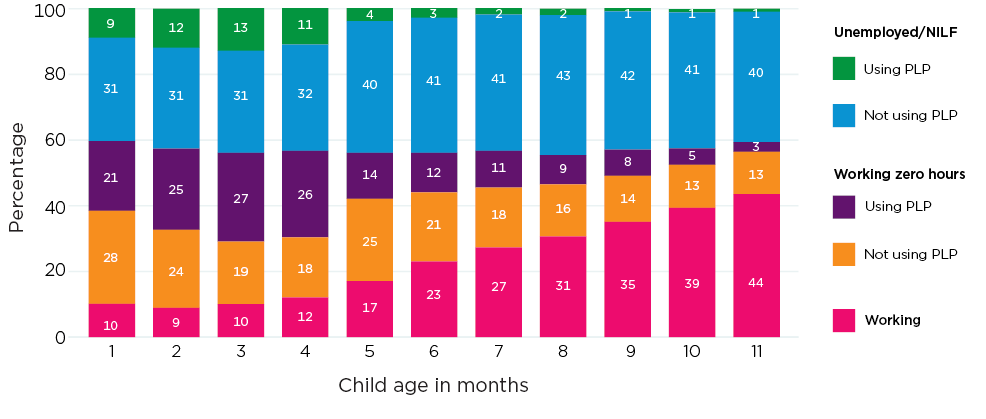
Notes: The indicator for PLP receipt for mothers who had been on PLP for more than 18 weeks reset to zero. NILF is Not in the labour force. Child age in months is approximate as child birth date was set to the first of the month for all children.
Source: PLIDA, DOMINO data update March 2023, linked to 2021 Census.
Later analysis with these data, in a subsequent report, will explore these patterns further, by personal and family characteristics, as well as job characteristics. See also Employment patterns and trends for families with children for some more analysis of Census data, across a number of Census years, showing the trends for mothers of under-one-year-olds.
4.4 Summary
The number of recipients using PLP trended upwards in the early years of its introduction and has generally remained around or just under 170,000 in more recent years. The number of DAPP recipients has also trended upwards at about half of the number of PLP recipients each year.
As a proportion of all families with a child under one year's old at the time of the 2021 Census, just over one in five mothers (22%) were using PLP, which was an increase from the estimated 19% at the 2016 Census. In both Census years, the proportion of fathers using DAPP was around one percent. As DAPP is a 2-week payment compared to the 18 weeks for PLP, it would be expected that fewer fathers would be observed to be on DAPP at any point in time relative to mothers receiving PLP.
There were marked differences in the proportion of mothers using PLP according to the age, in months, of their child under one year of age. These differences were related to the employment patterns of mothers, with many away from work with a newborn.
In 2016 and 2021, mothers were most likely to be receiving PLP when their youngest child was 2-4 months old (40-44% of mothers receiving PLP) or up to one month (33% of mothers receiving PLP). The proportion of mothers receiving PLP is considerably lower from the 5th month, but comparisons between 2016 and 2021 indicated there were more mothers receiving PLP in these later months in 2021. As mothers starting PLP later are likely doing so following a period of employer-funded leave, this higher proportion at later months in 2021 may reflect the gradual growth in the availability of this leave, or possibly reflect an increase in mothers making use of such leave to support their connection to employment.
13 That is, 7.65% of those on PLP at 2021 had a duration greater than 18 weeks. Some analysis in this report is based on unadjusted numbers. For example, the analysis in section 5 of characteristics of PLP and DAPP recipients is based on the unadjusted population of PLP recipients.
14 Age is approximate as child date of birth is only available as year and month of birth.
5 Characteristics of PLP and DAPP users
5.1 Introduction
This section steps through some personal and family characteristics, to describe the characteristics of those using PLP and DAPP, with comparisons to the broader population of new parents (that is, parents of a child under one year of age) where possible.
Analysis of regional information (State /Territory and remoteness) for PLP/DAPP recipients revealed no particular trends, and no marked differences in distribution compared to that of new parents overall. Findings are therefore included in Appendix Table 3 and Appendix Table 4.
5.2 Gender and relationships
PLP - gender and parental relationship
Given the eligibility requirements for PLP, it is not surprising that almost all the PLP recipients are female. Across all financial years, the average percentage female was 99.5%. This is consistent with the findings of the DSS (2015) review in which it was reported that more than 99% of PLP recipients in 2012-13 were female.
The majority of PLP recipients have a partner (95.4% in the pooled data across all years), so the majority of recipients are females with a partner (94.9%).15 DSS (2015) reported that of all parents who received PLP in 2012-13, 94.8% were partnered, and the data in PLIDA indicate the proportions have changed little year by year.
Looking further at the relationship data, Table 2 shows:
- Most PLP recipients are females with a male partner.
- While few in number compared to the female PLP recipients, there were more than 9,400 cases of the PLP recipients being males with a female partner. Further analysis of couple-level data indicated that in almost 70% of these cases, the female partner had also taken the PLP, so a portion of the PLP was transferred to the male.16 The remaining cases (about 30%) reflected when the father received PLP but the mother did not.
- Smaller numbers of recipients were single females (4.7% across all years), with smaller numbers again of females with a same-sex partner having received PLP. The numbers of males with a same-sex partner and single males accessing PLP since its introduction have been very small.
| Relationship | Percent | Number of PLP episodes |
|---|---|---|
| Female with male partner | 94.3 | 1,798,279 |
| Male with female partner | 0.5 | 9,404 |
| Single female | 4.7 | 90,055 |
| Female with female partner | 0.5 | 8,871 |
| Male with male partner | 0.0 | 441 |
| Single male | 0.0 | 227 |
| Total | 100.0 | 1,907,277 |
Notes: This is number and distribution of episodes, so if PLP is shared between parents for one child, it is counted once for each parent. Excludes those with start date after December 2022.
Source: PLIDA, DOMINO data update March 2023.
According to the Census, as with PLP recipients, the vast majority of families with a child under one year of age were opposite-sex couple families (89% in 2016 and 88% in 2021). The next largest group was single mothers (10% in 2016 and 11% in 2021), with around one per cent in total across other categories (single fathers, same sex couples).17 The higher proportion of infants living with a single mother in the population, relative to the PLP recipients, is likely to reflect a lower employment rate among single parents (even before they were pregnant with the PLP/DAPP child). See Appendix Table 6 for employment status of single and couple mothers at the time of the 2021 Census, and Appendix Table 7 shows that single mothers were more likely to be receiving Family Tax Benefit or a Parenting Payment at the time of the census compared to couple mothers (66% compared to 22%).
Taking a broader view using the linked 2021 Census-DOMINO, of families with a child under one year of age and a female parent, 62,345 (23%) of the female parents were receiving PLP on Census night. This PLP receipt calculation is based on the unadjusted indicator of PLP receipt, so includes those recorded as having received PLP for more than 18 weeks. For couple parents, the proportion was 25% and for single parents the proportion was 13%. See Appendix Table 7, indicating partnered mothers were much more likely than single mothers to be receiving no DSS payments at the time of the Census. We note that parents may also have been receiving financial support via the Child Care Subsidy, if using child care, but this subsidy is not included in this analysis.
DAPP - gender and parental relationship
The eligibility criteria for DAPP (see 'Dad and Partner Pay' section) leads to a very gendered distribution for this payment also. Across all episodes of DAPP to June 2021, 99.5% of recipients were male. This has varied little over the years.
Also, the majority of DAPP recipients are partnered males (97.9% in the data pooled across years). Of the balance, most are single fathers (1.6%). A very small percentage (0.5%) are partnered females, and further examination of these data finds that these cases are among females in same-sex relationships.
Using the linked Census-DOMINO data, of families with a child under one year of age and a male parent, 2,078 were receiving DAPP on Census night in 2016 and 2,420 in 2021. In both years this was about one percent of fathers. Almost all of these were opposite-sex couple parents.
5.3 Family relationships and size
PLP and DAPP - parent-child relationship
According to the analysis of Census data, the vast majority of children under one year of age are living with a natural or adopted mother (98% in 2016 and 96% in 2021). The percentages are even higher when subset to those families in which the mother is receiving PLP at the time of the Census (99% in 2016 and 97% in 2021). For DAPP recipients, according to the analysis of linked Census-DOMINO data, almost all DAPP recipients at 2016 and 2021 were natural or adopted fathers.
Consistent with this, the DSS (2015) review, reporting on characteristics among PLP recipients in 2012-13 found that 99.4% were birth mothers, 0.4% were the partner of birth mothers, 0.1% were adoptive parents (or partner of adoptive parent) and 0.1% fell into other categories. Information about the relationship between the PLP or DAPP recipient and the child was not available in PLIDA.
Family size and repeat use of PLP
Among under-one-year-olds in the 2021 Census, 44% had no siblings (aged under 15 years), 1.4% had at least one other sibling also aged under one year and 55% had a sibling aged between 1 and 14 years. Overall, 37% had one sibling and 20% had 2 or more siblings. Findings for 2016 were very similar.18
Given the relationship between parenthood and mothers' employment (e.g. New mothers staying connected to the workforce), women having a first child are more likely to be employed in the months leading up to the birth than are those having a second or subsequent child. It is therefore expected that for PLP, first time mothers are more likely to meet the work test and will be over-represented within the population of PLP users compared to the broader population of mothers.19
This association between family size and use of PLP is apparent in the linked Census-DOMINO data. For 2021, of mothers of a child under one year of age, who have only one child, 26% were using PLP at the time of the Census, compared to 24% for those with 2 children and 17% for those with 3 or more children aged under 15 years (see Appendix Table 7).
A different perspective to this is to what extent mothers have used PLP multiple times, for subsequent births. By 2021-22, 9% of PLP recipients were using it for their third (or later) time, as their families grew, with 33% using it for the second time.
Family size and repeat use of DAPP
In recent years, about 58% of DAPP users were using it for their first child, 32% for the second child and 10% for a third or later child. By 2020-21, 61% of DAPP recipients were using it for the first time, 34% were using it for the second time, and another 5% using it for their third (or later) time. (See footnote 18 about derivation of family size.)
Multiple births
The incidence of multiple births among PLP and DAPP recipients is very low. Across all the incidences of PLP use, the child was one of a multiple birth in 1.3% of families, and for DAPP, the child was one of a multiple birth in 0.9% of families.20 As noted above, according to the 2021 Census, 1.4% of under-one-year olds had at least one sibling also aged under one years. Parents of multiple births can access PLP and/or DAPP in respect to one of the children - there is no additional PLP/DAPP for multiple children. However, parents who meet the eligibility criteria can apply for the Newborn Upfront Payment and Newborn Supplement in respect to the siblings of the child that PLP/DAPP is claimed for. Further analysis that incorporated information on these payments found that 59% of PLP recipients (or their partner) with a multiple birth received the Newborn Upfront Payment and/or Supplement.
5.4 Parents' age
The median age of mothers of under-one-year olds was 31 years in 2016 and 32 years in 2021.
- At 2016, 10.4% of new mothers were aged under 25 years, 25% were aged 25 to 29 years, 37% aged 30-34 years, 21% aged 35-39 years, and 6.7% aged 40 years and over.
- At 2021, 8.0% of new mothers were aged under 25 years, 23% were aged 25 to 29 years, 38% aged 30-34 years, 24% aged 35-39 years, and 6.6% aged 40 years and over.
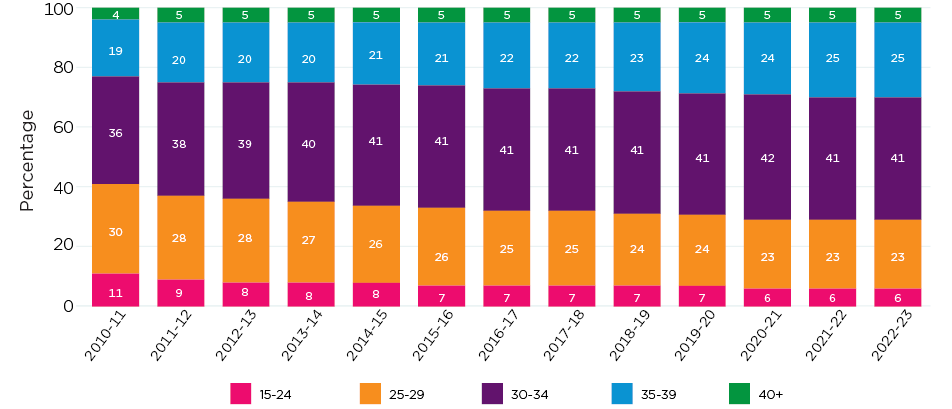
The median age of PLP recipients (pooled across years) is the same as the 2021 median from the Census, at 32 years. Figure 3 shows that the distribution, by age group, is also similar to that of new mothers in the Census, although the PLP users are more often in the largest group, of 30-34 year olds. There has been little change in the median age (in whole years) for PLP users across financial years, although Figure 3 suggests that the distribution has shifted a little toward older mothers.
The under-representation of the youngest mothers in the PLP recipients likely reflects the employment rate in this group being lower, even before the birth of the first child. At the time of the Census, there are marked differences in employment rates by age of mother, especially for the youngest mothers. See Appendix Table 6. This is also reflected in lower percentages using PLP among the youngest mothers (15%), see Appendix Table 7.
Figure 3: The peak age for mothers is 30-34, with more 35-39 year olds receiving PLP than 25-29 year olds in recent years
Mothers' age at commencement of PLP, by financial year of PLP commencement
Note: This is based on episodes of PLP. Excludes those with start date after December 2022.
Source: PLIDA, DOMINO data update March 2023
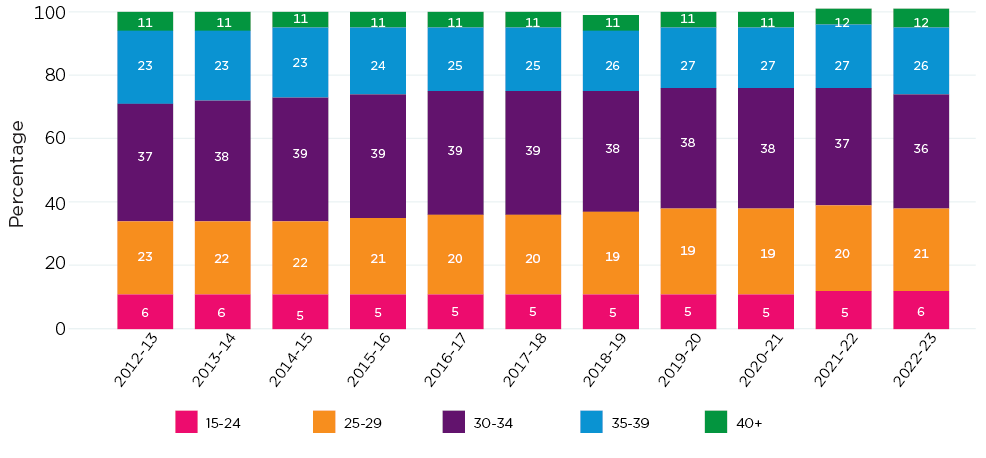
Figure 4: The peak age group for fathers using DAPP is 30-34
Fathers' age at commencement of DAPP, by financial year of DAPP commencement
Note: This is based on episodes of DAPP. Excludes those with start date after December 2022.
Source: PLIDA, DOMINO data update March 2023
At 2016 and 2021, the median age of fathers of under-one-year olds in the population was 34 years. The median age of fathers using DAPP is 33 years and Figure 4 shows that among DAPP recipients, the peak age group for receipt of DAPP is at 30-34 years. The proportion aged 35-39 years has been higher in the last five or so years compared to the years immediately following the scheme's introduction.
5.5 Parental education
Mothers' education and PLP
Highest level of educational attainment is typically strongly associated with patterns of employment, with weaker labour force participation among those with lower levels of educational attainment. See this association for the 2021 Census, for mothers, in Appendix Table 6. However, as higher education levels are likely to equate to higher incomes, among employed mothers, those with lower levels of education may more often be using PLP as those with the highest incomes will not be eligible. Those with higher levels of education may also have better paid leave arrangements through their jobs, although mothers with good paid leave conditions may still use PLP if their income does not preclude their eligibility. Use of PLP is expected to be greater among those with higher levels of education, given the association between education and employment, but as noted here, these other factors may dampen these differences somewhat.21
Looking from the perspective of mothers with a child under one year of age at the time of the 2021 Census, among those with incomplete secondary education, 10% were receiving PLP, of those with completed secondary education only, 19% were receiving PLP, and 25-26% of those with a certificate/diploma, bachelor degree or higher were receiving PLP. See Appendix Table 7.
These differences mean that among mothers of children aged under one year who were receiving PLP at the time of the Census, education levels were somewhat higher compared to education levels for all mothers. Among PLP users 4% had incomplete secondary education; 11% had complete secondary education only; 34% had completed a certificate or diploma; 48% had a bachelor degree or higher, with 3% missing information. This compares to the distribution for all mothers of under one-year-olds in 2021: 9% had incomplete secondary education; 13% had complete secondary education only; 31% had completed a certificate or diploma; 43% had a bachelor degree or higher, with 4% missing information.
In subsequent work with these data, we will explore how patterns of PLP use vary by education as well as age of child.
Fathers' education and DAPP
Differences in DAPP use by fathers according to educational attainment are expected to some extent, although fathers cannot use DAPP when on paid leave from employment. If employers do not top up DAPP to usual salary, then higher earning fathers (as is typically associated with higher education) may be less likely to take DAPP, in addition to the income test precluding some. Among fathers of under-one-year olds in 2021, the distribution of highest levels of educational attainment were: 9.5% had incomplete secondary education; 12% had complete secondary education only; 40% had completed a certificate or diploma; and 34% had a bachelor degree or higher, with 4% missing information. The distribution for those receiving DAPP at the time of the Census was somewhat different, with the proportion with a certificate or diploma (47%) higher than in the population and the proportion with a bachelor degree or higher (31%) lower than in the population. Another 7% had incomplete secondary and 13% completed secondary education. These findings may reflect differential access to paid parental leave through employment in different industries and will be explored further in later work.
5.6 Overseas-born parents
Overall, 71% of PLP recipients were Australian-born, with this percentage varying a little over the years. Also, among mothers receiving PLP at the time of the 2021 Census, 71% were Australian-born. These percentages are higher than the percentage of new mothers in the Australian population (63% of mothers of under-one-year olds in 2021. This reflects that there are higher employment rates among Australian-born mothers (see Appendix Table 6 and Appendix Table 7). It may also reflect a greater awareness of PLP among Australian-born mothers.
Across all incidences of DAPP, 66% were Australian-born recipients. Among fathers receiving DAPP at the time of the 2021 Census, 69% were Australian-born. This compares to 62% of fathers of under-one-year olds in 2021. As for mothers, some of2 this is related to different employment rates among fathers according to whether they are Australian-born.22
5.7 Aboriginal and/or Torres Strait Islander parents
The percentage of PLP recipients that are Aboriginal and/or Torres Strait Islander is 2.2%, with all years combined. This percentage within PLP recipients is lower than the percentage that is Aboriginal and/or Torres Strait Islander in the Census (3.2% of mothers in 2016 and 3.7% of mothers in 2021), as above likely reflecting the lower employment rates of Aboriginal and/or Torres Strait Islander mothers (see Appendix Table 6 and
Appendix Table 7).
The percentage of DAPP recipients that are Aboriginal and/or Torres Strait Islander is similar to the percentage for mothers, at 2.1%. This proportion is not greatly different to the percentage of fathers that are Aboriginal and/or Torres Strait Islander in the Census (e.g., 2.3% in the 2016 Census).
5.8 Income - personal income
The income test for PLP and DAPP (see Box 1) means that those with a personal income above the cut-off point (annual income around $150,000) will not be eligible for these payments. The income test is based on individuals' adjusted taxable income in the previous financial year. With this specific income measure not available in PLIDA, the following analysis uses ATO income data. The measure used is the total financial year payment (total income or loss), for the financial year before the PLP or DAPP commences. At the time of doing this analysis, the ATO data were available up to the 2019-20 financial year, so they cover PLP/DAPP used up to, and including, the 2020-21 financial year.
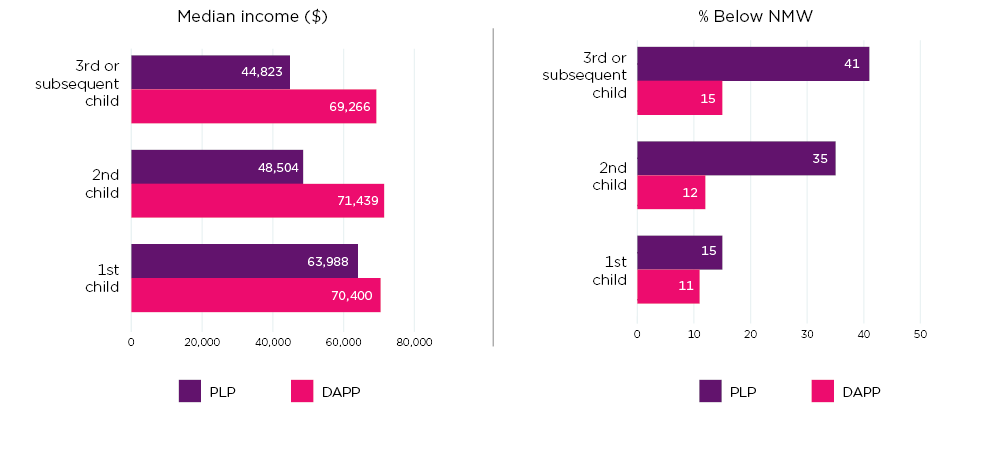
Table 3 presents previous financial year income for DAPP and PLP users. The median is higher for DAPP recipients than PLP recipients, with 27% of PLP recipients and 14% of DAPP recipients (pooled across years) having had incomes below minimum wage in the financial year before they started payment.
The lower incomes for PLP recipients reflect the effects on income of women reducing time in employment after the birth of a first or later children. As seen in Figure 4, using recipients starting PLP in 2020-2021 as an example, those starting PLP for a first child had much higher median incomes the year before, compared to those using PLP for a second or subsequent child. For DAPP recipients, these differences are not apparent.
| Year | PLP | DAPP | ||
|---|---|---|---|---|
| Median ($ annual) | % below NMW | Median ($ annual) | % below NMW | |
| 2011-12 | 54,140 | 24.0 | N/A | N/A |
| 2012-13 | 54,792 | 23.3 | 63,923 | 16.0 |
| 2013-14 | 53,393 | 25.4 | 65,330 | 14.3 |
| 2014-15 | 52,156 | 27.6 | 64,762 | 14.1 |
| 2015-16 | 52,425 | 27.6 | 65,438 | 14.2 |
| 2016-17 | 52,819 | 28.0 | 65,963 | 14.6 |
| 2017-18 | 52,260 | 29.0 | 66,152 | 15.0 |
| 2018-19 | 52,724 | 29.4 | 67,443 | 14.6 |
| 2019-20 | 54,413 | 28.0 | 69,178 | 13.6 |
| 2020-21 | 54,140 | 26.1 | 70,636 | 11.9 |
| Pooled | N/A | 27.0 | N/A | 14.1 |
Notes: Income was adjusted by CPI to be in 2020-21 dollars. The NMW (National Minimum Wage) weekly amount was multiplied by 52 to calculate an annual equivalent for comparison to annual income for the same year (before CPI adjustment). While the ATO income data is different to the Adjusted Taxable Income (ATI) used to assess eligibility, these findings are broadly consistent with DSS-reported income data on PLP recipients. The 2014 review report found that the median ATI among PLP recipients was $44,350 in 2011-12 and $47,000 in 2012-13. They also reported that 27% had ATI below NMW in 2011-12 and 25% in 2012-13.
Source: PLIDA, DOMINO data update March 2023 and ATO data to 2019-2020
Figure 5: PLP recipients' income is strongly related to number of children
Median financial year income and percentage with incomes below National Minimum Wage in 2019-2020, parents starting PLP or DAPP in 2020-2021.
Notes: NMW is National Minimum Wage. See other notes on Table 3.
Source: PLIDA, DOMINO data update March 2023 and ATO data
5.9 Summary
The majority of PLP recipients are females with a partner. Of the very small number of cases in which the PLP recipient was male with a female partner (0.5% of all episodes of PLP), in 70% of cases it appeared that part of the PLP had been transferred to the male from a female partner also having used PLP.
Comparisons between the PLP recipient characteristics and families with an under-one-year old at the 2016 and 2021 Censuses revealed some differences, that typically reflected there being a greater connection to employment among some cohorts of mothers. Those groups with lower levels of labour force participation were under-represented in the population of PLP recipients. This included single mothers, mothers with larger families, younger mothers, mothers with lower levels of educational attainment, and overseas-born and Aboriginal and/or Torres Strait Islander mothers.
The analysis in this report does not include job characteristics. There is variation across the labour market in the availability of employer-provided paid parental leave and it is likely that PLP would be especially valued by those mothers without employer-funded leave. However, as PLP can be taken by mothers while they are on leave from employment, these differences in job characteristics may matter less to whether mothers take PLP, and more to when that PLP is taken.
With regard to DAPP, almost all recipients were partnered males (98%). As for mothers, there were some differences in use of DAPP by some of the characteristics examined. DAPP differs to PLP in that it cannot be used while on employer-funded leave. Some findings, such as the relatively high incidence of fathers with certificate or diploma qualifications, may reflect that these fathers are likely to be in industries that have lesser access to paid parental leave.
The analysis of income shows the differences between mothers' and fathers' incomes, comparing PLP and DAPP recipients. It also shows the impacts of having a larger family size on the incomes of PLP recipients. At this stage, take up of PLP by pre-birth income has not been analysed. This will be explored in a subsequent report using these data.
15 This information is derived from recipients' relationship status, with the analysis incorporating partners' gender undertaken by linking partner demographics (such as gender) to the recipients' information.
16 See Transferring your Parental Leave Pay for a child born or adopted before 1 July 2023 - Parental Leave Pay for a child born or adopted before 1 July 2023 - Services Australia for guidelines about sharing PLP.
17 These estimates are slightly different to those reported earlier in the publication, which is due to having used different datasets in the calculations.
18 Around the same time as the 2016 Census (2016-17 financial year) among parents using PLP, 54% were using PLP for their first child. This is consistent with expectations that first-time mothers would be over-represented among PLP recipients. In particular, the proportion using PLP for a 3rd or later child was lower (12%) compared to the proportion of under-one-year olds in the Census with 2 or more siblings (20%). Analysis by family size using DOMINO draws on data on all children in DOMINO, for PLP and DAPP users. It is possible that this information is incomplete if parents received no payments from Services Australia in respect to those children. Since about 2017-18, about 51% are first-time mothers, about 35% second-time mothers and 14% using PLP for their third or later child. In 2011-12, based on the DOMINO data, these percentages were 72%, 26% and 2% respectively. Similar differences occurred in exploring family size for DAPP recipients, with the majority in 2012-13 and 2013-14 (84%) having only the one child's data in the database. This changed considerably over subsequent years.
19 While data are not available on employment before the birth, the relationship between family size and employment is apparent. See summarised data in Appendix Table 1.
20 This assumes that, in the case of multiple births, other children's details are recorded with Services Australia. The data may be incomplete.
21 Educational attainment in DOMINO is missing for most PLP and DAPP recipients, so the Census data on educational attainment is used in this section.
22 At 2021, 94% of Australian-born fathers were employed compared to 88% of overseas-born fathers.
6 How PLP and DAPP are used
6.1 When do parents start on PLP and DAPP?
PLP commencement
There is expected to be some variation in when PLP is accessed. Mothers with paid leave provided through their employment may take this paid leave first, and then use PLP to fund a period of leave that would otherwise be unpaid, should they wish to take a longer period of leave than is covered by their employer-provided paid leave. Others may choose to receive PLP while they are also receiving a paid leave entitlement from their employment. Those without paid leave from their employment would be expected to take PLP as soon as eligible after the birth.
Timing of commencement could not be derived accurately, as child age is recorded in PLIDA with only year and month, not the specific date. The following analysis is based on calculations that use the date of birth being the first day of the month, and timing is derived as the number of days between this date and the start of PLP and DAPP.
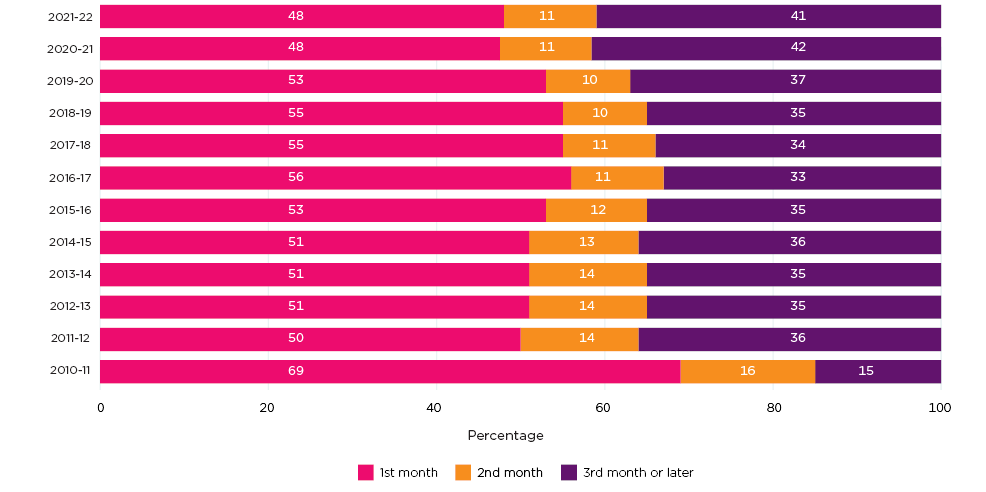
Across all data from 2010-11 to 2019-20, using the child's date of birth as described above, the median timing of PLP commencement was the first month after the child's birth. In 2020-21 and 2021-22, the median had slightly shifted to be the second month. Figure 6 shows the start time in more detail. Since the introduction of PLP, around one in two mothers started PLP in the first month after the birth, with this proportion declining in more recent years.23 The proportion starting PLP in the third month or later has increased since the scheme's introduction, with 41% starting at this time in 2021-22, compared to 36% ten years earlier. This change may indicate impacts of mothers having greater access to paid parental leave through their employment, and mothers choosing to delay the commencement of PLP to start once this leave entitlement is exhausted.
These findings are consistent with the overall patterns by child age, showing increased proportions of mothers using PLP when their children are between 5 and 11 months old (see Figure 1).
Figure 6: In recent years around 2 in 5 mothers are starting PLP after the first 2 months
Months since first day of birth month to start date of PLP, by financial year of PLP commencement
Note: Timing of commencement is an approximation. While date of start on PLP is known, day of month of birth is not known.
Source: PLIDA, DOMINO data update March 2023
Multivariate analysis of who starts PLP early
While the timing of commencement of PLP is likely strongly related to employment factors, here we have presented some findings from analysis of how timing of commencement varies with a range of available demographic variables. These do not include employment variables, as this information is not available in the DOMINO data.24
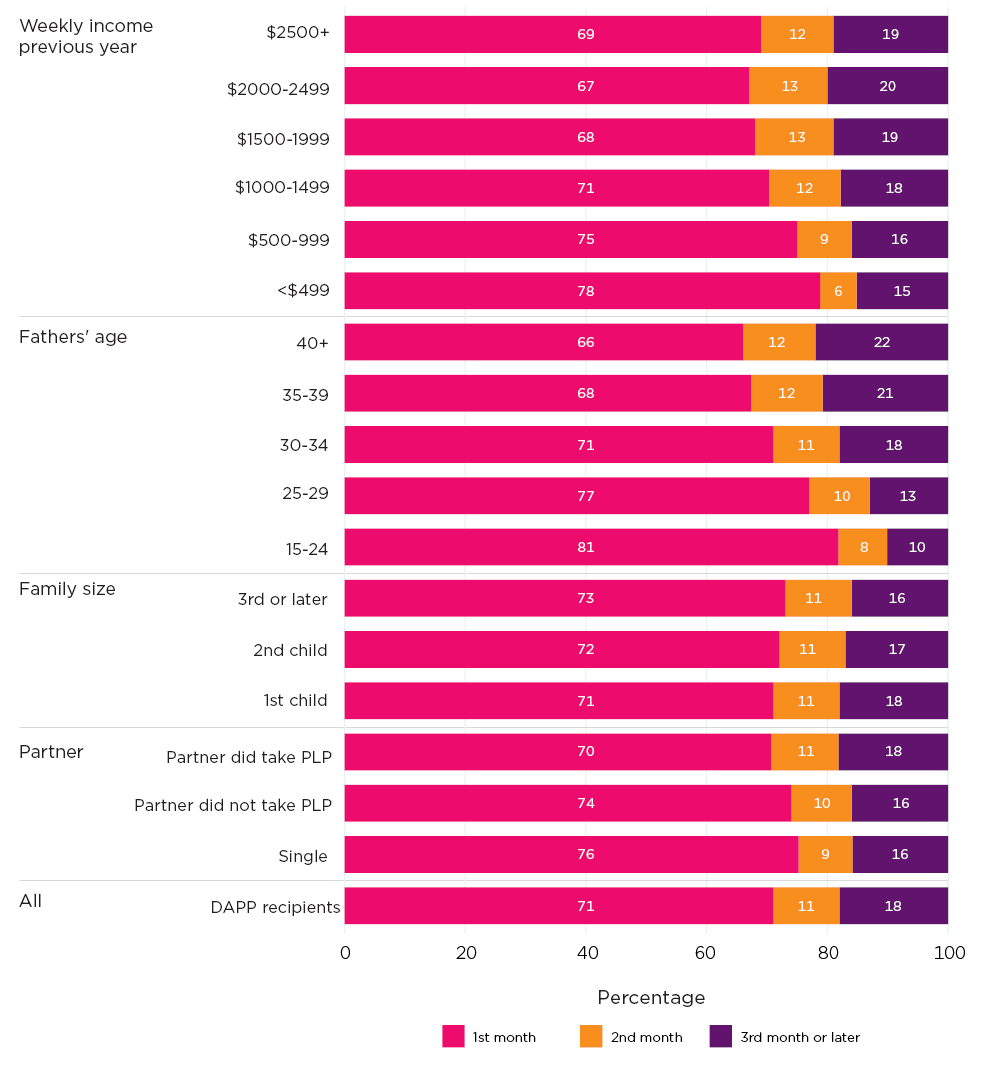
Selected predicted values, showing three broad categories of timing of commencement, are shown in Figure 7. Focusing on the likelihood of starting early:
- Those with the lowest incomes before the birth are the most likely to start early. This includes those with weekly income before the birth of up to $1,500 (inflation-adjusted), with less variation between income bands once income is more than this.
- The youngest mothers (aged 15-24 years) are the most likely to start PLP in the first month, with the likelihood of starting early decreasing with each older age group.
- Single mothers are most likely to start PLP in the first month.
- Noting that some fathers share in the PLP, fathers' PLP start time is much more likely to be later compared to mothers using PLP.
While not shown as predicted values in Figure 7, there were also significant findings for other variables (see the multivariate results in Appendix Table 9). Starting early was more likely if overseas-born, Aboriginal and/or Torres Strait Islander and if the child was not one of a multiple birth. There were some differences by remoteness and across states and territories.
Starting PLP early is likely to be an indicator of having no paid parental leave through employment, so the findings related to low income, young mothers and single parenthood are expected to reflect these mothers having been more often working in jobs without paid leave entitlements. Timing of PLP use is examined further later, when looking at this from the child's perspective (see Child-level perspectives in section 7).
Figure 7: Young mothers, single mothers and those with lowest (previous year) incomes are most likely to start PLP early
Predicted values from multivariate analysis of timing of PLP start
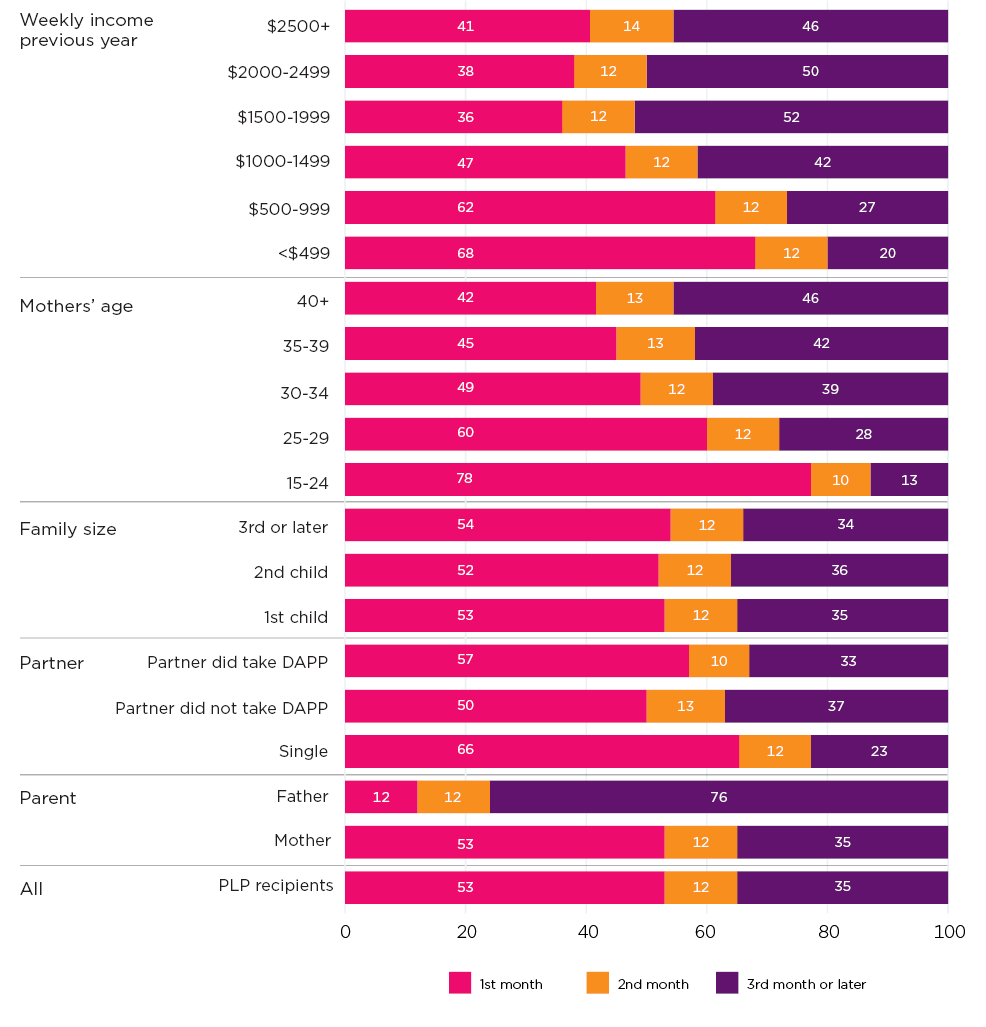
Notes: Timing of commencement is an approximation. While date of start on PLP is known, day of month of birth is not known. Full multivariate results are in Appendix Table 9. Predicted values are calculated following multinomial logistic regression that also includes state, remoteness, financial year, whether Australian-born, whether Aboriginal and/or Torres Strait Islander, family size, whether one of multiple birth. Predictions are done over the full population of PLP recipients up to those starting in 2020-2021. Later data were excluded due to the extent of missing income and geographic information after this time. Income was adjusted by CPI to be in 2020-21 dollars.
Source: PLIDA, DOMINO data update March 2023
DAPP commencement
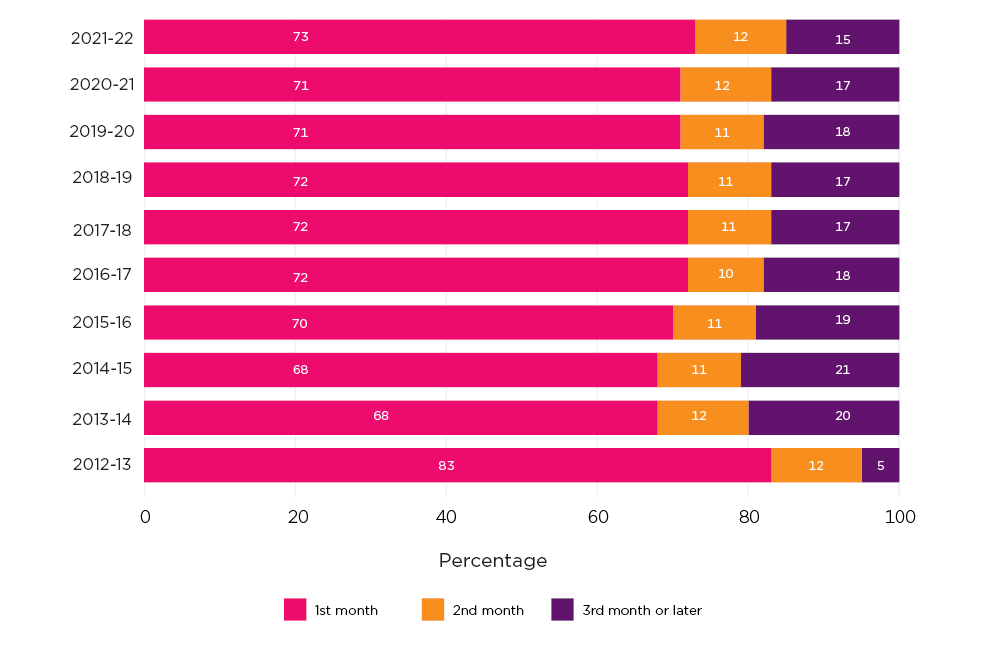
Across 2012-13 to 2021-22, the median timing of DAPP commencement was within the first month after the child's birth. While this did not vary over the financial years, Figure 8 shows a slight increase in the proportion taking it within the first month.
Figure 8: More than two in three fathers started DAPP in the first month
Months since first day of birth month to start date of DAPP, by financial year of DAPP commencement
Note: Timing of commencement is an approximation. While date of start on DAPP is known, day of month of birth is not known.
Source: PLIDA, DOMINO data update March 2023
Multivariate analysis was used to see what factors were associated with starting DAPP at different times. Selected findings are presented as predicted values in Figure 9 (with model estimates in Appendix Table 10).
- Fathers with the lowest incomes were the most likely to have started DAPP in the first month after the birth
- Younger fathers were most likely to start in the first month. With increased age, fathers were more likely to start DAPP later.
Figure 9: Early DAPP commencement was most likely for young fathers and fathers with lowest (previous year) incomes.
Predicted values from multivariate analysis of DAPP start time
Notes: Timing of commencement is an approximation. While date of start on DAPP is known, day of month of birth is not known. Full multivariate results are in Appendix Table 10. Predicted values are calculated following multinomial logistic regression that also includes State, remoteness, financial year. Predictions are done over the full population of DAPP recipients up to those starting in 2020-21. Later data were excluded due to missing income and geographic information. Income was adjusted by CPI to be in 2020-21 dollars.
Source: PLIDA, DOMINO data update March 2023
6.2 Length of time on PLP or DAPP
PLP
The design of PLP allows for 18 weeks of payment. The vast majority of PLP recipients use all 18 weeks, rather than using less than this, such as by returning to work or transferring PLP to another parent (Table 4). With the introduction of Flexible PLP in July 2020, parents can use an initial block of 12 weeks, then use the remaining 6 weeks flexibly up until the child's second birthday. This has had the effect of increasing the elapsed time from start to end of some parents' PLP, explaining the percentage in Table 4 with apparently more than 18 weeks of PLP (7-8% of recipients).25
| Up to 17 weeks (%) | 18 weeks (%) | >18 weeks (%) | Total (%) | |
|---|---|---|---|---|
| 2010-11 | 1.9 | 98.1 | - | 100.0 |
| 2011-12 | 2.4 | 97.6 | - | 100.0 |
| 2012-13 | 2.6 | 97.4 | - | 100.0 |
| 2013-14 | 3.1 | 96.9 | - | 100.0 |
| 2014-15 | 3.4 | 96.6 | - | 100.0 |
| 2015-16 | 3.4 | 96.6 | - | 100.0 |
| 2016-17 | 3.3 | 96.7 | - | 100.0 |
| 2017-18 | 3.5 | 96.5 | - | 100.0 |
| 2018-19 | 3.5 | 96.5 | - | 100.0 |
| 2019-20 | 3.5 | 96.5 | - | 100.0 |
| 2020-21 | 3.1 | 89.9 | 7.0 | 100.0 |
| 2021-22 | 1.6 | 90.0 | 8.4 | 100.0 |
Notes: Excludes 2022-23 as the data are incomplete. Longer than 18 weeks reflects those with elapsed time from start to finish of greater than 18 weeks. This likely reflects recipients using the Flexible Paid Parental Leave provisions and breaking the PLP into more than one block. These specific blocks of PLP cannot be identified in the data used to date.
Source: PLIDA, DOMINO data update March 2023
Long PLP as an indicator of FPLP
As noted above, having an elapsed duration on PLP of more than 18 weeks is likely to indicate extending the period of PLP through use of Flexible PLP. To explore this, multivariate analysis was done using the indicator variable of having the elapsed number of days from start to end being more than 126 days. The cohort used in the analysis was PLP recipients who started PLP after July 2020 but excluding those using PLP at 1 January 2023, whose elapsed time had not yet reached 18 weeks.
Taking the indicator of having long PLP as an indicator of using Flexible PLP, some findings from Figure 10 are:
- Higher income mothers (that is, higher income the year before starting PLP) were more likely to be using Flexible PLP - the higher the income, the more likely it was mothers had PLP with an elapsed duration of more than 18 weeks.
- The older mothers more often used Flexible PLP, as well as the youngest mothers.
- Single mothers more often use Flexible PLP compared to partnered mothers.
Full multivariate results are in Appendix Table 11.
We note that these results assume having a long elapsed duration of PLP indicates using Flexible PLP. It may be that some mothers intended to use the flexibility, banking some leave for later use or to share with a partner, but did not end up using that leave. More analysis will be needed to determine to what extent this occurred, and perhaps occurred more often in particular cohorts.
Figure 10: Higher incomes, youngest and oldest ages, and single parenthood were associated with the indicator of flexible PLP
Predicted values from multivariate analysis of long duration on PLP, PLP started in 2020-2021, selected variables
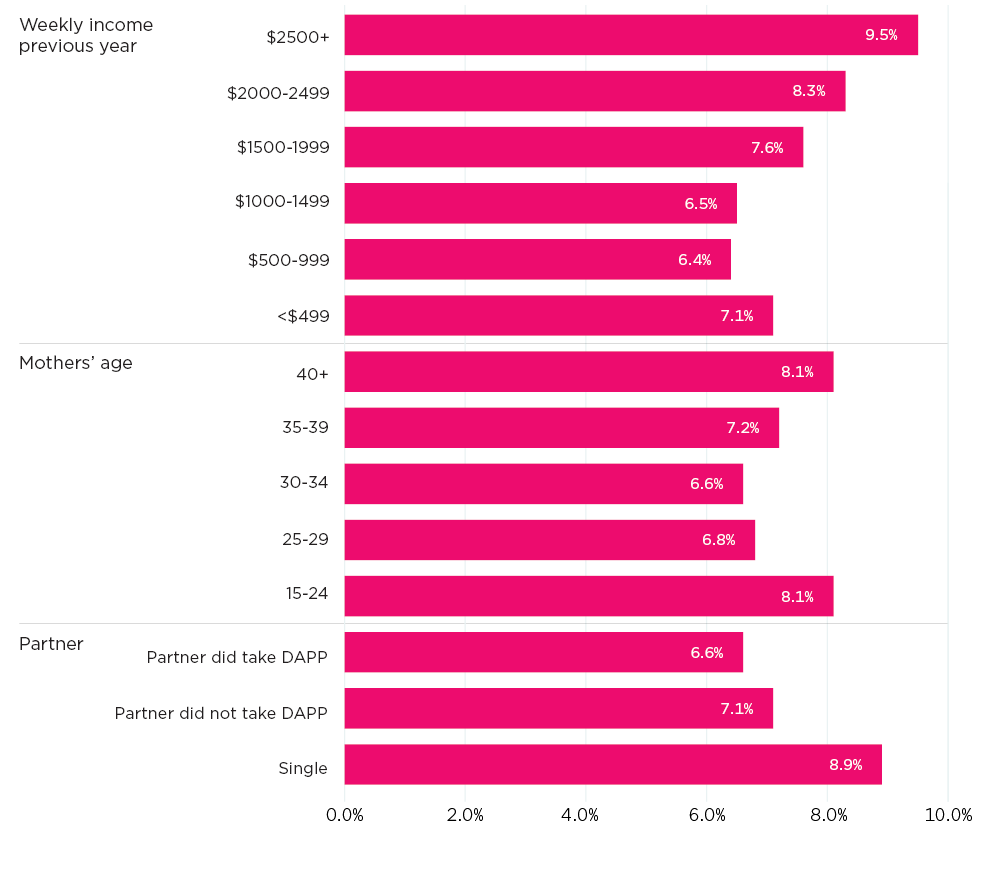
Notes: Full multivariate results are in Appendix Table 11. Predicted values are calculated following logistic regression that also includes state, remoteness, financial year, family size, multiple birth, whether Aboriginal and/or Torres Strait Islander, overseas-born, and gender. Predicted values calculated over the population starting PLP in 2020-21. Later years were excluded due to missing data on income.
Source: PLIDA, DOMINO data update March 2023
DAPP duration
As with PLP, for DAPP, the majority receive payment for the full duration, which is 2 weeks. Across all years, 96% of DAPP recipients had 2 weeks of DAPP. Given this high usage of the full entitlement, no further analysis of DAPP duration was done.
6.3 Summary
This analysis has focused on a couple of dimensions of PLP and DAPP, of the timing of commencement of these payments and of the duration of the payments.
The timing of commencement was analysed with imperfect data - with child date of birth known only in respect of the month (and year) of birth, so this could not be perfectly aligned to the start dates on payments. Nevertheless, the general approach provided some visibility of those starting 'early' and those starting later.
A great limitation of this analysis was having no visibility on whether parents had access to, or used, paid employer-funded parental leave at any time. Some of the findings reported here, by demographic variables such as age and previous year's income, are expected to reflect that mothers in particular cohorts were more likely to be working in jobs that offered paid leave. That is, those mothers with paid leave may have been inclined to use that leave first, and then supplement a further period of unpaid leave with payment from Paid Parental Leave. However, mothers may have decided to use PLP at the same time as any employer-funded leave, so the data could not be used to speak with certainty about patterns of leave-taking overall. Regardless, the findings are suggestive of mothers having used PLP sooner when in jobs that did not offer paid leave entitlements.
There was more constraint for fathers in when DAPP could be used, as fathers were not able to use DAPP while on employer-funded leave. Further, DAPP was a 2-week payment (as opposed to the 18 weeks for PLP). The analyses showed that it was most common for fathers to start DAPP in the first month, and younger fathers and fathers with lower incomes were the most likely to start earlier. Like the mothers, these fathers could be expected to have been more often in jobs that did not offer paid leave entitlements, such as paid parental leave, so starting DAPP early likely indicated that DAPP provided otherwise unavailable options to take time off work early after a birth.
The analysis of duration on PLP and DAPP showed that it was rare for parents to take less than the full amount of the payment. The analysis of duration on PLP, however, showed that the elapsed time between start and finish of PLP was extended with the introduction of Flexible Paid Parental Leave for about 7-8 percent of PLP recipients. This suggested that some mothers were banking up some PLP for later use, although the data used to date did not provide insights on how Flexible PLP was being used. The analysis of parental characteristics associated with having a long duration on PLP, as a possible indicator of using Flexible PLP, indicated that as well as (previous) high income recipient mothers more often using longer PLP, this was also apparent among young mothers and single mothers. Further analysis of the data is warranted to determine how Flexible PLP was being used, and to what extent some mothers did not end up using PLP they banked up for later use.
23 Patterns differed in the year of introduction of PLP, many more starting it in the early weeks after the birth.
24 Further analysis with PLIDA is planned, incorporating information from other sources. The multivariate analysis details are provided in the Appendix.
25 The data provide information on the PLP start date, the PLP end date and the number of days between these two dates. Between the start and end date, however, recipients may be using the flexible PLP option (from July 2020) such that gaps in Parental Leave Pay are not observed. More detailed payment information is available in another dataset in DOMINO, and this was explored to determine whether it would show the gaps or part-time use of PLP. However, attempts at aligning the payments data with the main benefit dataset proved problematic. We will investigate further to see if challenges with these data can be resolved.
7 Within family use of PLP and DAPP
7.1 Partnered recipients
Whether partner used PLP or DAPP
This section turns to analysis focusing on couples and within family use of PLP and DAPP. From the perspective of partnered PLP and DAPP recipients and pooling information across all data:
- Among couple parents receiving PLP about 1% had a partner also receiving PLP for that same child (i.e., the PLP was shared)
- From 2013, when DAPP was introduced:
- Among partnered parents receiving PLP, 38% had a partner receiving DAPP for the same child. This is explored further below.
- Among partnered parents who received DAPP, 75% had a partner receiving PLP for the same child. While the incidence of this has not been explored further in this report, it will be useful to consider which fathers do not have a partner using PLP, with the most recent changes to PLP meaning that fathers will not have access to PLP (replacing DAPP from July 2023) if mothers were not also eligible for PLP.
Within couples, parents did not always access these payments at the same time. See 'Concurrent use of PLP/DAPP within couples' section in Section 7 for more about timing of access to these payments.26
Which PLP recipients had a partner receiving DAPP?
Again focusing on the partnered PLP recipients, this section examines in which families the fathers used DAPP as well as the mother receiving PLP. Above we noted that this is the case for 38% of partnered mothers. Predicted values from multivariate analysis are presented in Figure 12. These show, for example:
- Mothers aged 25-29 years and using PLP are the most likely to have a partner also taking DAPP (a predicted percentage of 44%). The percentage is lower at younger ages but is markedly lower when mothers are aged 35-39 years or 40 or more years (35% and 31% respectively).
- Mothers using PLP and with a previous financial year income of $500-$999 per week or $1,000 to $1,499 per week were the most likely to have a partner receiving DAPP (41% and 42% respectively). The higher the previous-year income, the lower the likelihood the partner would use DAPP, for example with a predicted probability of 28% among those with previous income of $2,500 or more per week.
Full multivariate results are in Appendix Table 12.
A limitation of this approach is that it only used the mothers' characteristics. The fathers' characteristics are likely to be very pertinent to their decisions about whether to use DAPP. In particular, their access to paid leave through their employment will be an important factor, as well as their income relative to the DAPP amount.
Figure 11: In PLP-using families, DAPP was most often used for first children and 25-29 year-old fathers
Predicted percentage of fathers taking DAPP in couple families with PLP
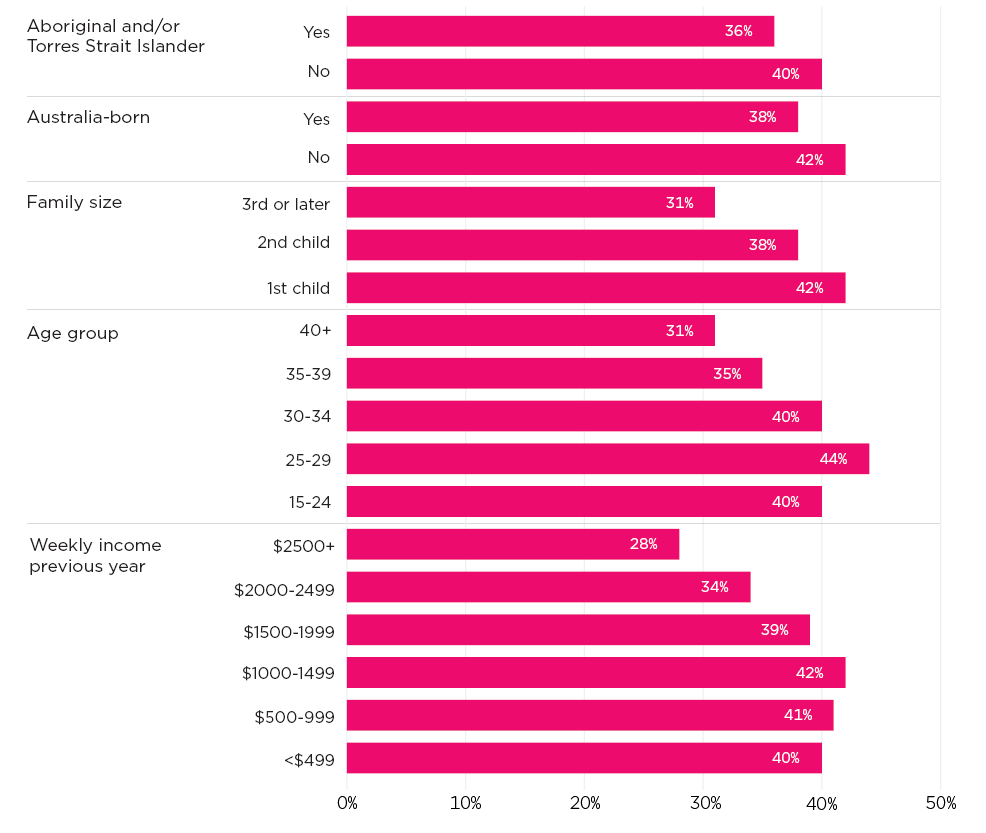
Notes: Full multivariate results are in Appendix Table 12. Uses recipient data from 2013-14 to 2020-21. Predicted values are calculated following logistic regression that also includes State, remoteness, financial year, gender of PLP recipient. Predictions are done over the full population of PLP recipients up to those starting in 2020-21. Later data were excluded due to missing income and geographic information. Income was adjusted by CPI to be in 2020-21 dollars.
Source: PLIDA, DOMINO data update March 2023
Couples and sequencing of start of PLP and DAPP
Bringing in some information on the sequencing of PLP and DAPP commencement in couple families that used both PLP and DAPP, Table 5 shows:
- In most (although not all) years, it was most common for DAPP to be used first (45% of couples using both PLP and DAPP in 2021-22).
- The next most common sequencing was for DAPP and PLP to start at the same time (34% in 2021-22).
- The smaller group was mothers starting PLP before the fathers started DAPP (22% in 2021-22).
This only provides information about the start times of PLP and DAPP, and does not tell us about whether parents were on leave before or after their PLP/DAPP receipt. However, a later start of PLP relative to DAPP is likely to be an indicator that mothers had access to paid leave through their job, which they used before using the PLP. Having PLP and DAPP start together is very likely to reflect taking this payment, together, soon after the birth.
The variation in the sequencing over some demographic variables suggests this sequencing is related to delays in mothers' start of PLP (see Figure 12).
- The sequence of DAPP before PLP is most likely for older mothers, first-time mothers and those who had been on higher incomes in the year before the PLP commenced.
- The sequence of DAPP and PLP starting together is most likely for the younger mothers and mothers on the lowest incomes.
| PLP first (%) | DAPP first (%) | Started together (%) | Total (%) | Total number of couples accessing DAPP and PLP (n) | |
|---|---|---|---|---|---|
| 2012-13 | 27.2 | 40.4 | 32.3 | 100.0 | 25,232 |
| 2013-14 | 30.7 | 38.7 | 30.7 | 100.0 | 55,322 |
| 2014-15 | 29.8 | 38.0 | 32.3 | 100.0 | 55,227 |
| 2015-16 | 28.7 | 36.7 | 34.6 | 100.0 | 60,531 |
| 2016-17 | 27.4 | 35.3 | 37.3 | 100.0 | 62,521 |
| 2017-18 | 26.5 | 36.8 | 36.7 | 100.0 | 64,566 |
| 2018-19 | 26.2 | 37.0 | 36.8 | 100.0 | 69,895 |
| 2019-20 | 25.2 | 39.5 | 35.4 | 100.0 | 69,535 |
| 2020-21 | 24.3 | 44.4 | 31.2 | 100.0 | 72,406 |
| 2021-22 | 21.8 | 44.6 | 33.6 | 100.0 | 77,612 |
Source: PLIDA, DOMINO data update March 2023
Concurrent use of PLP/DAPP within couples
The start and end dates of PLP and DAPP were used to determine whether parents were using these payments at the same time for all or part of the period of payment. See Table 6, in about half the instances that a couple used both PLP and DAPP, there was a complete overlap in the period of payment. As noted above, this doesn't shed light on which parents were on (any) leave together or separate, only providing insights about the period of PLP and DAPP. For example, among the 'no overlap' group will be mothers who used paid parental leave from an employer while the father was using DAPP. The 'no overlap' group therefore cannot be interpreted as meaning parents were on leave alone. The very high proportion of 'no overlap' among those that sequenced DAPP before PLP, in particular, is likely to represent those mothers who were using leave from employment before they commenced PLP.
| Start sequencing | Full overlap (%) | Partial overlap (%) | No overlap (%) | Total (%) | Total number, couples using DAPP and PLP |
|---|---|---|---|---|---|
| DAPP then PLP | 0.0 | 9.1 | 90.9 | 100.0 | 248,001 |
| PLP then DAPP | 66.2 | 2.4 | 31.4 | 100.0 | 167,050 |
| Together | 100.0 | 0.0 | 0.0 | 100.0 | 222,572 |
| All | 52.2 | 4.2 | 43.6 | 100.0 | 637,623 |
Note: Pooled data across years for all couples that used PLP and DAPP.
Source: PLIDA, DOMINO data update March 2023
Figure 12: With couples each taking PLP and DAPP, parents were most likely to start PLP and DAPP at the same time when younger and lower income before the birth
Sequencing of PLP and DAPP in couples, by selected demographics
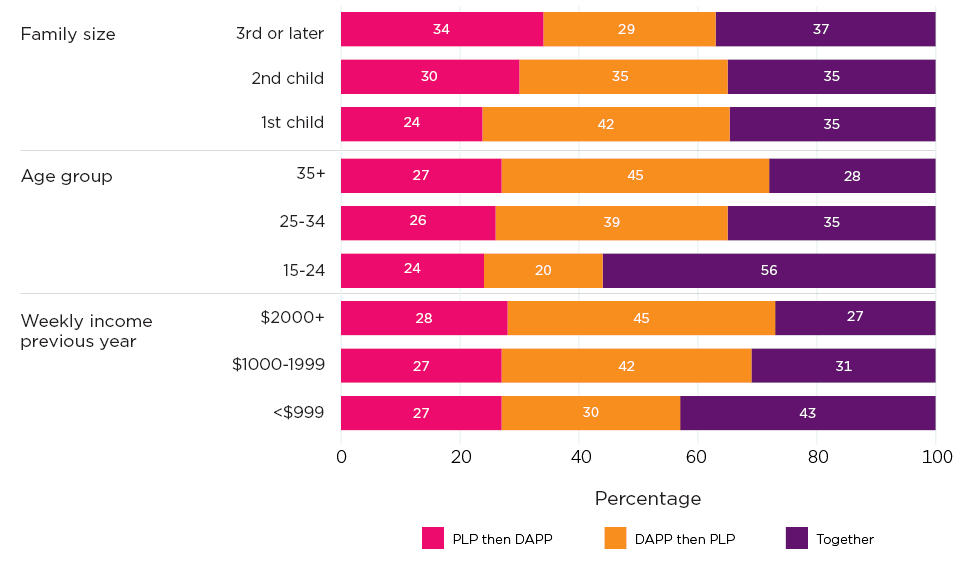
Notes: Uses pooled couple-level data from 2013-14. Income data are only available up to 2020-21. Incomes were adjusted by CPI to be in 2020-21 dollars.
Source: PLIDA, DOMINO data update March 2023
7.2 Child-level perspectives
This section changes the focus to explore how PLP and DAPP were used in respect of children, allowing a family-level perspective on whether one or more parents made use of PLP and/or DAPP.
Overall child numbers and parents' use of PLP and DAPP
Appendix Table 8 shows the numbers of children covered by PLP, DAPP or both.
In 2021-22, 202,983 children had one or both parents using PLP or DAPP. This included:
- 77,539 children had a parent using PLP and a parent using DAPP
- 104,391 children had a parent using PLP, but no parent using DAPP
- 21,053 children had a parent using DAPP but no parent using PLP.
The detailed table compares these numbers over financial years. It also shows the proportion of children for whom PLP was shared between 2 or more people. This was typically about 0.3-0.4% of children each year, although was higher at 0.6% in 2020-21 and 2021-22.
Timing in months since the birth
Extending the analysis of commencement of PLP and DAPP presented previously, here timing of use of PLP and DAPP is presented in months from the child's birth, with start and end date of the payment used relative to the year and month of birth to identify when one or both parents is receiving these payments.27 As noted previously, a limitation of this analysis is that the actual birth date is not known, so analysis assumes a birthdate of first of the month.
The analysis is based on those children for whom either parent used PLP. It does not include children whose parents had not received PLP. The restriction to those children who had a parent taking PLP, rather than PLP or DAPP, was to avoid impacts on the percentages of the size of the population increasing when DAPP was introduced. Analysis of PLP that focuses on all families, using Census data, was presented in section 4.2, and more analysis is presented in the PLP and other DSS payments section.
Figure 13 shows that PLP and DAPP have distinct distributions, of course to some extent related to the former being an 18-week payment and the latter a 2-week payment. To compare these distributions over time, the data are presented in three broad years groupings. The first is before 2012/13, which is prior and up to the first 6 months of the DAPP's introduction. The second is from 2012/13 to 2019/20, so before the introduction of Flexible Paid Parental Leave. The final grouping is 2020/2021 onward. As with the analysis presented in section 4.2, for mothers' PLP, two lines are shown for the latter period. One is based on an adjusted measure of PLP receipt, assigning the value of no PLP to mothers who were reported to be still on PLP, but the duration had exceeded longer durations. As data are analysed here in months rather than weeks, once mothers had elapsed duration of more than 5 months, their PLP was considered no longer active.
For mothers and PLP, among children with a mother on PLP:
- The proportion using PLP increases through the first few months. For example, in the period 2020/21 onward, 47% had a mother on PLP in the first month (labelled zero, less than one month). When the child was around one month, it was 59%, at two months it was 68%, and at 3 months it was 75%. The peak was 81% for children aged around 4 months.
- While the peak was at 4 months in all of the periods, as grouped in Figure 13, the proportions using PLP earlier were greatest in the 2010/11 to 2012/13 period.
- The peak at four months was 88% of children (with a parent using PLP) for the 2010/11 to 2012/13 period, 85% of children for the 2013/14 to 2019/2020 period, compared to the 81% for the more recent period.
- The introduction of Flexible Paid Parental Leave has an impact on these data, as mothers may bank some of their PLP to use later once they have completed a 12-week block. The data used only give start and end date of the PLP, without visibility of pauses due to this flexibility, which results in mothers apparently being on PLP longer than 18 weeks. Adjusting for this to some extent in the figure (see 'adjusted' line) suggests a portion of mothers are delaying some use of PLP until later in the child's first year, with the proportions receiving PLP over children's ages of 6 to 11 months being higher in the 2020/21 to 2022/23 period.
- This analysis has not considered how much PLP is used in the child's second year, but these data indicate only a small percentage of PLP recipients are still receiving PLP by the child's first birthday.
Figure 13: The proportion receiving PLP increases during the first months, DAPP is most often used in the 2 months
Whether children have mother and/or father on PLP/DAPP, by months old and start year of payment (grouped)
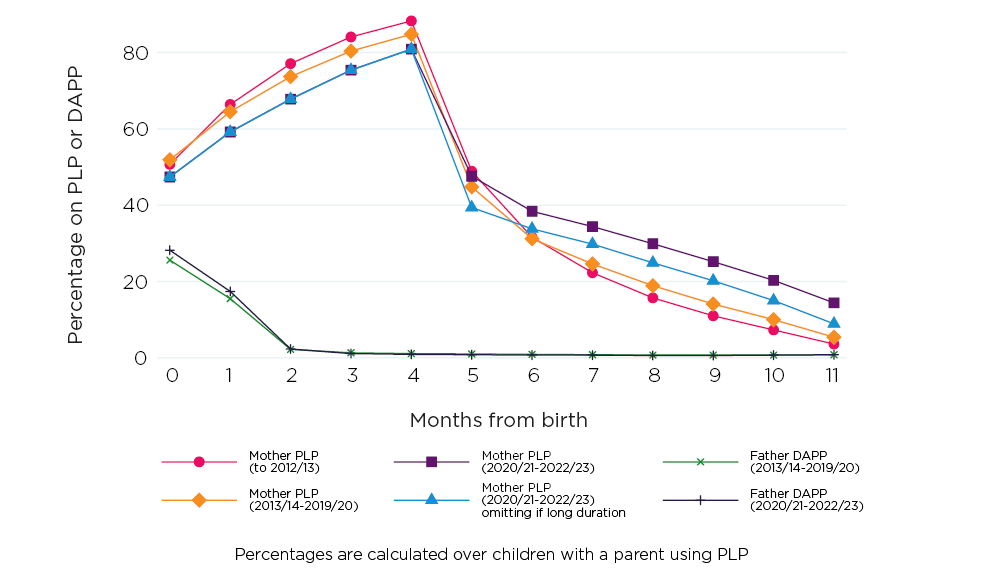
Notes: Timing of PLP/DAPP is an approximation. While start and end date of PLP and DAPP is known, the day of month of birth is not known. Excludes those with start date after December 2022, so 2022-23 data are incomplete. The adjusted line for mothers starting from 2020/21 removes the data point if at that time mothers have already reached a total duration of 5 months. It is likely these mothers have used flexible leave options and have not completed their PLP but may not actually be receiving payments at these later weeks.
Source: PLIDA, DOMINO data update March 2023
Noting that the population here is families in which PLP was used, looking at DAPP:
- The peak time for fathers to be on DAPP is in the first month or two after the child's birth.
- Among children with a parent using PLP, in the period 2013-14 to 2019-20, 26% of children had a father using DAPP when the child was aged under one month and 16% when aged about one month.
- In 2021-2022 and 2022-23, 28% had a father using DAPP when the child was aged under one month and 17% when aged one month.
- Unlike PLP, DAPP cannot be taken while also on paid leave from employment, and the relative frequency of use in the first month likely reflects use by fathers who have access to little employer-funded parental leave.
- By child age of 2 months, only 2% of children had a father receiving DAPP, and percentages were even lower after this.
The following figures look at how timing varies for different cohorts (by age group of mother and mothers' income the year before PLP commencement). The graphs are not discussed in detail as the patterns reflect two underlying patterns that have already been discussed:
- There are differences in timing of commencement on PLP, as discussed in the When do parents start on PLP and DAPP? section. Earlier commencement on PLP is apparent for younger mothers (see Figure 14), and mothers previously on lower incomes (see Figure 15).
- For findings related to fathers' use of DAPP, the differences often reflect a lower incidence overall of fathers using DAPP. For example, analysis discussed in the Partnered recipients section showed lower likelihood of fathers using DAPP when mothers were older and when mothers had higher incomes.
Figure 14: Youngest mothers use PLP sooner after the birth
Whether children have mother and/or father on PLP/DAPP, by months old and broad year and mothers' age
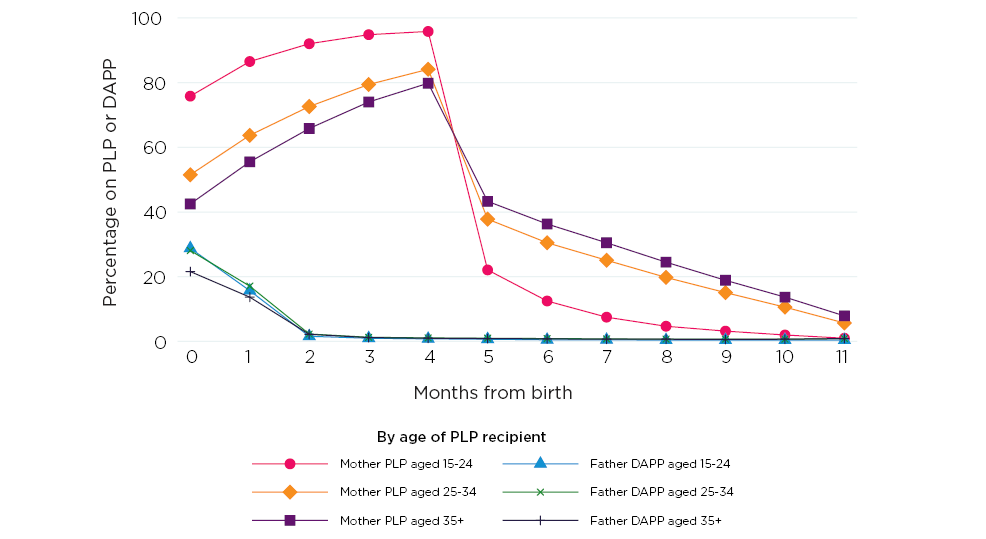
Notes: See Figure 12 for data notes. Excludes 2011-2012 data. Calculations derived over the population of children with a parent on PLP.
Source: PLIDA, DOMINO data update March 2023
Figure 15: Lower income mothers use PLP earlier
Whether children have mother and/or father on PLP/DAPP, by months old and mothers' pre-birth income
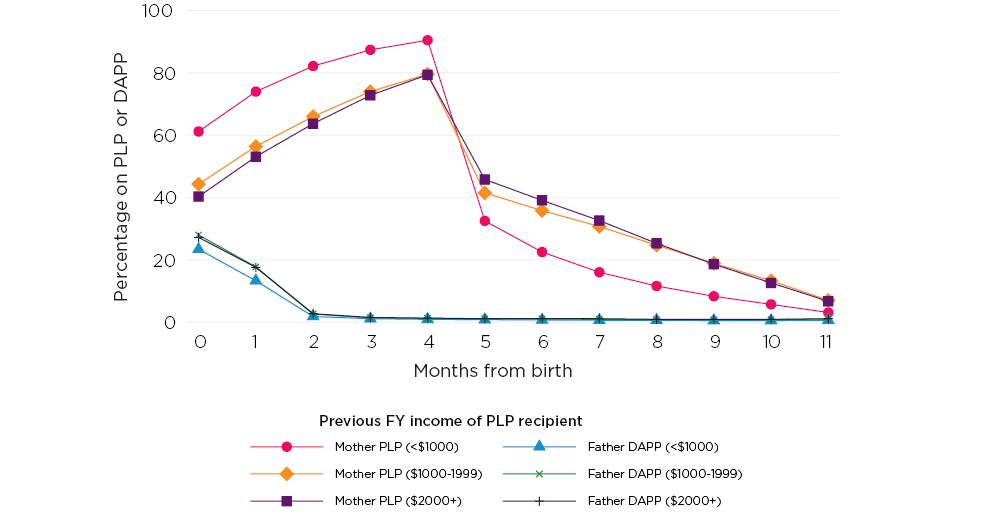
Notes: See Figure 12 for data notes. Excludes 2011-2012 data. Calculations derived over the population of children with a parent on PLP.
Source: PLIDA, DOMINO data update March 2023
7.3 Summary
This section has explored some of the patterns of use of PLP and DAPP from a family and child perspective, combining information on PLP and/or DAPP.
One question of interest is to what extent parents shared PLP. Consistent with the earlier recipient-level data, this analysis shows that couples rarely share the PLP between them. That is, the whole of the PLP is typically taken by the mother. This analysis found that in about one percent of couples, both parents received some of the PLP. It was more common (from 2013) for parents to both be using PLP and DAPP, such that in 38% of the couple families with one parent receiving PLP, the other parent received DAPP. Mothers were least likely to have a partner taking DAPP if mothers were in the older age groups (35-39 years or more) or had incomes in the highest income ranges.
If looking from the other perspective, of families in which a partnered parent received DAPP, 75% had a partner receiving PLP.
Within couples that used both PLP and DAPP, it was most common for DAPP to be used at least in part before the PLP, although it was also relatively common for parents to commence DAPP and PLP at the same time. These patterns seemed to reflect the timing of receipt of DAPP and PLP, with a later start of PLP likely indicating mothers had first used employer-funded leave. When DAPP and PLP started together, this often reflected taking each soon after the birth. Looking further at the overlapping of PLP and DAPP receipt, in about half the instances that a couple used both PLP and DAPP, there was a complete overlap in the period of payment. However, given the data only relate to periods on PLP and DAPP, they do not provide insights on to what extent each of a couple might be on any kind of leave at the same time.
Timing of use of PLP and DAPP was explored here according to (approximate) months from the child's birth and focusing on children who had a parent receiving PLP. The analysis showed the very different age-related patterns for PLP and DAPP, which is in part related to the former being an 18-week payment and the latter a 2-week payment. For DAPP, children were most likely to have a father receiving DAPP in the first one to two months. Children are most likely to have a parent receiving PLP in their fifth month, with the percentages having increased month by month from the first month. After the fifth month, there were considerably fewer children with a parent receiving PLP.
Comparisons of these percentages were made over periods of financial years, parental age and previous financial year income. Over time, there was further indication of PLP being used later, while the differences by age and income also were consistent with previously presented data that showed earlier use of PLP among young mothers and mothers previously on lower incomes.
26 The linked Census-domino data also provides insights about partners' receipt of payments on Census night. Among partnered mothers receiving PLP at the time of the 2021 Census, 1.7% had a partner receiving DAPP at the same time. Among partnered parents receiving DAPP at the 2021 Census, 42% had a partner receiving PLP at the same time. Note that some of those classified as being on PLP at the time of the Census will be on a 'gap' in the flexible PLP. These numbers are very different to those derived from the DOMINO data alone, as the broader analysis takes account of any PLP/DAPP in respect to a child, with it being common that parents are not on PLP and DAPP at exactly the same time (see Table 6).
27 For PLP use that indicates the elapsed time since starting is greater than 18 weeks, from any time after week 12 to the end, the recipient may not be actually using PLP at a point in time, as the start and end date do not reveal breaks in PLP use that may occur when PLP is being used flexibly. For Flexible PLP (FPLP), the first 12 weeks must be taken in one block. There will therefore be some overstating of PLP use in these cases where FPLP is used. The duration data indicate this is a relatively small proportion of recipients.
8 PLP and other DSS payments
8.1 Introduction
As noted in the Alternative and supplementary payments section in Chapter 2, there are other kinds of financial support available to parents around the birth of a child. This section provides an overview of this, focusing on the year after the birth. The analysis uses the 2016 and 2021 Census data linked to DOMINO, to report on the payments received by mothers with a child under one year of age at the time of the Census, contextualising PLP against these other payments. The focus is on mothers, given they are most often the recipient of family-related benefits.
The analysis does not include the Child Care Subsidy, which is another form of financial assistance from the government available to eligible families using formal child care. This subsidy reduces the cost of child care to families. Information on the Child Care Subsidy is not available in PLIDA.
8.2 Overview of most relevant DSS payments
Birth-related payments and supplements
Payments specifically for births, supplementing PLP from 2011 to 2023 were:28
- The Baby Bonus, available until 2014. Between 2011 and 2014, parents could access either PLP or the Baby Bonus for a specific child. The Baby Bonus was paid in 13 fortnightly instalments, with a higher first instalment.
- The Newborn Upfront Payment and Newborn Supplement (from 2014 to currently). As for the Baby Bonus, parents can access either PLP or these payments. The upfront component is a one-off payment, with the supplement included in rate of Family Tax Benefit (FTB) Part A for 13 weeks.
- The Stillborn Baby Payment (from 2021 to currently) is a lump-sum payment for those who have recently had a stillborn baby, with eligibility based on an income test. Alternatively, parents with a stillborn baby can access PPL if they meet eligibility requirements. Other payments were available to these parents before 2021.
Family and parenting related payments and allowances
In addition to the birth-related payments, families with a very young child may be receiving family allowances and/or receiving income support payments including the following.
- Parenting Payment (Partnered or Single) is an income support payment. This payment is subject to residence rules, an assets test and an income test. Eligibility criteria changed in 2023, but for the period of time covered by this report, eligible recipients must be the main carer of children aged under 8 years (if single) or under 6 years (if partnered). Only one parent can receive Parenting Payment. There is an interaction between receipt of PLP and the amount of Parenting Payment received.
- FTB Part B is payable to single-income families with children, such as single parents and couples with one income (or two incomes, but one of them very low). It is paid per family rather than per child. The amount is subject to an income test, taking account of both partners' income in the case of couple families. Parents cannot get FTB Part B while they are getting PLP. However, there may be some overlap for those using the flexible component of PLP (that is, using Flexible Paid Parental Leave) since the introduction of this policy in July 2020. 29
- FTB Part A is a fortnightly payment paid per eligible child. Eligibility is subject to an income test and residence rules. The income cutoff for eligibility depends on numbers and ages of children. For example, for families with one child at March 2023, no FTB Part A is payable for family income more than $108,892. The amount payable varies with income and ages of children. Failing to meet immunisation requirements may affect payment rate of FTB Part A.
- Multiple Birth Allowance is for families with triplets or quadruplets or more, being an additional amount included in the rate of payment for FTB Part A.
This list of family payments, income support payments and allowances is not exhaustive. Other pensions and allowances are available to those in particular circumstances, such as those with disability or caring responsibilities. Other kinds of support are available, for example, to help with rent (rent assistance) and health care (health care card), as well as to help with the costs of child care (Child Care Subsidy).
PLP/DAPP and Newborn Upfront Payment/Supplement
As noted above, the Newborn Upfront Payment and/or Supplement is available to eligible parents who are not using PLP. It is also available to parents of multiple births, as they can use PLP for one child, and this payment/supplement for other children. This payment/supplement is not specifically included in the Census analysis that follows, as it is paid as an add-on to Family Tax Benefit and was not identified as a separate payment in the dataset used. However, additional analysis was done to capture overall statistics on use among families that had either parent receiving PLP or DAPP.
Among families that had a PLP recipient, who had a multiple birth, 59% also received the Newborn Upfront Payment and/or Supplement.
Overall, in data from 2014-15 onward:
- Among PLP recipients, the Newborn Upfront Payment and/or Supplement had been received in 1.9% of families. This included 1.8% of couple families in which the partner had not received DAPP or PLP, 1.8% of couple parent families in which the partner had received DAPP or PLP, and 4.0% of single parent PLP recipients.
- Among DAPP recipients, the Newborn Upfront Payment and/or Supplement had been received in 19% of families. This included 77% of couple families in which the partner had not received PLP, 1.8% of couple parent families in which the partner had received PLP, and 4.2% of single parent DAPP recipients.
8.3 Payments at Census 2016 and 2021
Overall and by age of youngest child
To report on the kinds of payments or allowances received by mothers of a child under one year of age, the linked Census-DOMINO data was used to determine which of the following payments (if any) the mother was receiving at the time of the 2016 and 2021 Censuses.30 These included:
- PLP (see also comments about measuring PLP receipt earlier, in section 4.2)
- Parenting Payment (Partnered or Single)
- Other non-FTB DSS payments and allowances. The most common ones were Carer allowance and Carer Payment. In addition, Rent Assistance was commonly received as a supplement to Family Tax Benefit.
- FTB Part B
- FTB Part A
The analysis in subsections below is descriptive, aiming to provide an overview of the sources of income for families in the months following the birth of a child, putting PLP into context with other kinds of DSS payments and allowances.
The proportions of mothers with a child under one year of age receiving DSS payments are shown in Figure 16, for 2016 and 2021.
- In 2016, 41% of mothers received no DSS payments, and in 2021 this was higher, at 47%.
- The most common DSS payment/allowance received was FTB Part A, covering 45% of mothers in 2016 and 36% in 2021.
- Next most common was FTB Part B, which similarly declined from 40% of mothers in 2016 to 31% of mothers in 2021.31
- In 2016 PLP was being used by 19% of mothers, and this was slightly higher in 2021 at 22%.
Mothers may have been receiving multiple payments, so the percentages in Figure 16 add to more than 100%. Of interest is to what extent mothers receiving PLP were receiving other payments, and further analysis found that 28% of mothers receiving PLP were also receiving FTB Part A at the time of the 2021 Census. This meant 72% of PLP recipients were not receiving this payment.
Figure 16: Nearly half the new mothers were not receiving DSS payments or allowances at the time of the Census, with FTB the most commonly received financial support
Percentage of mothers of children under one year-old receiving common DSS payment/allowance types on Census night in 2016 and 2021
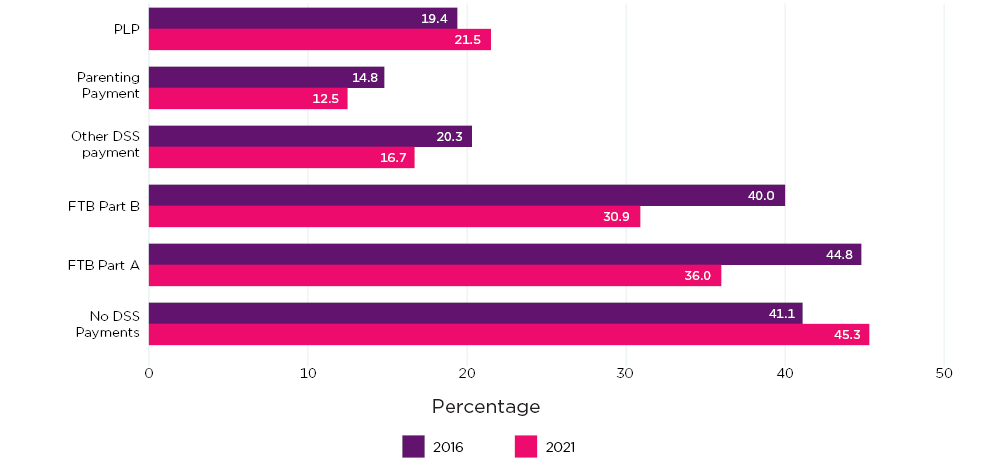
Note: FTB Part B estimates may be overestimates (see footnote 31).
Source: PLIDA, DOMINO data update March 2023, linked to 2021 Census
There may be some overestimates in these statistics, as mothers may have been recorded as receiving a payment, while actually receiving a nil rate. The patterns should be read as indicative rather than precise estimates. Table 7 shows that among mothers receiving PLP, single mothers were much more likely than couple mothers to be receiving other DSS payments, especially FTB.
Table 7 also shows that among mothers not receiving PLP at the time of the Census, 60% received no DSS payments or supplement, with this percentage higher at 65% for couple mothers compared to 21% for single mothers. The most common payment or allowance received by those not using PLP was FTB. For example, 32% of couple mothers and 77% of single mothers who were not using PLP received FTB Part A. Single mothers were more likely than couple mothers to receive the other kinds of DSS payments listed, especially Parenting Payment.
| DSS payment/allowance received on Census night | Receiving PLP at Census | Not receiving PLP at Census | ||||
|---|---|---|---|---|---|---|
| Couple % | Single % | Total % | Couple % | Single % | Total % | |
| FTB Part A | 25.5 | 63.0 | 27.8 | 32.4 | 77.2 | 38.0 |
| FTB Part B | 19.8 | 60.4 | 22.2 | 27.0 | 75.7 | 33.1 |
| Parenting Payment (Partnered or Single) | 0.4 | 23.9 | 1.8 | 9.1 | 58.2 | 15.3 |
| Other DSS payment/supplement/allowance | 7.5 | 28.2 | 8.8 | 14.9 | 46.2 | 18.9 |
| No DSS payments | 0.0 | 0.0 | 0.0 | 65.1 | 20.7 | 59.5 |
| Number of mothers | 54,077 | 3,471 | 57,548 | 183,707 | 26,257 | 209,964 |
Note: FTB Part B estimates may be overestimates (see footnote 31). Child Care Subsidy is not included. Percentages add to more than 100.0 as mothers may be receiving more than one payment/allowance.
Source: PLIDA, DOMINO data update March 2023, linked to 2021 Census
The age-related patterns of PLP use were discussed earlier, in section 4.2. For the other DSS payments, there were no distinct patterns by age in months of youngest child. There was, however, a pattern to the proportion of mothers who received no DSS payments. This is the inverse of the proportion who received PLP and, given that 72% of PLP recipients were not receiving FTB Part A, it is likely that when they conclude PLP, most will resume receiving no DSS payments. That is, PLP is a temporary measure for many mothers, helping to support their financial wellbeing and connection to employment in the immediate time after the birth.
Figure 17: PLP is the only payment with a strong relationship to child age
Percentages of mothers of a child under one year of age receiving DSS payments, by age of youngest child in months, 2021
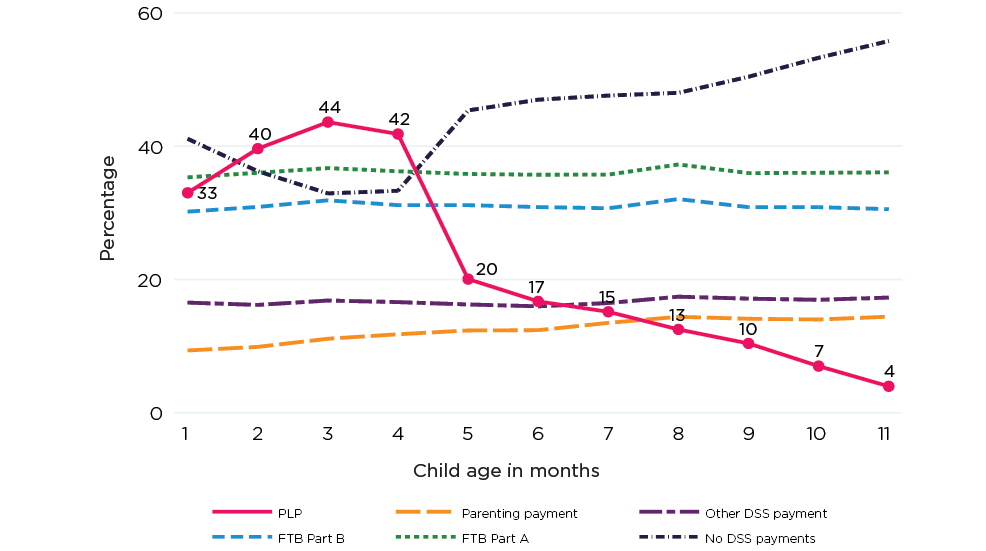
Notes: Child age in months is approximate as child birth date was set to the first of the month for all children. FTB Part B estimates may be overestimates (see footnote 31). Parenting Payment can be split into Parenting Payment single, which went from a low of 5.4% for children aged one month up to 8.0% for children aged 11 months, and Parenting Payment Partnered, with lower proportions across the child's first year, from 3.8% at the first month up to 6.4% at the eleventh month.
Source: PLIDA, DOMINO data update March 2023, linked to 2021 Census
8.4 Summary
This analysis was undertaken to put PLP into context with other DSS payments received by families following the birth of a child. The analysis uses the linked Census-DOMINO data to explore DSS payments received at the time of the 2016 and 2021 Censuses.
The most commonly received DSS payments are the FTB payments, although a significant proportion of mothers are not receiving any DSS payment. This was the case more so in 2021 (45%) compared to 2016 (41%).
A number of payments are available to families with a newborn, with some payments more relevant to those without the connection to employment that PLP requires. This includes Parenting Payment and Family Tax Benefits (Parts A and B). For these two payments, the proportion receiving them does not vary with the detailed information on child age in months. This contrasts with the strong age-related patterns for PLP receipt, and also the age-related patterns associated with the non-receipt of DSS payments. The analysis of these data showed that just under 3 in 10 mothers receiving PLP were also receiving FTB Part A, but the majority were not receiving this payment. This, along with the marked age-related patterns of non-receipt of DSS payments indicates that for a majority of mothers, the government is providing only temporary financial support via PLP. Given the return-to-work patterns of mothers seen at the beginning of this report by age of youngest child in months (see
Figure 2), the increase in the proportion receiving no payment as children's age in months increases no doubt largely reflects a lack of eligibility for DSS payments once families' incomes increase from mothers' return to work.
28 If parents have a multiple birth, they may be able to access PLP in respect to one of the children, and one of the other payments in respect to another child.
29 Analysis of the linked Census and FTB data indicated that large numbers were on FTB Part B while also receiving PLP, suggesting that the FTB data information was not separating out those receiving no payment. We have therefore limited the reporting on the results of analysing these data.
30 This information does not include specific reporting on some payments described above. The Baby Bonus was no longer applicable for the periods examined (2016 and 2021). The Newborn Upfront Payment and Supplement are connected to Family Tax Benefit Part A, they have not been reported on separately. These payments were not separately identified in the benefit history dataset used. This report does not cover the Stillborn Baby Payment nor the Multiple Birth Allowance, which are discrete payments for specific situations.
31 In tabulating these data by the indicator of PLP receipt, we noted a high proportion were recorded as receiving FTB Part B, as well as PLP. This suggests the FTB Part B information may also be capturing some parents who are on hold from (have a nil rate of) FTB, rather than receiving an FTB payment. These overall estimates of receipt of FTB Part B are likely overestimates of the proportions receiving these payments.
9 Summary
This report has examined use of PLP and DAPP, making use of PLIDA to explore trends in the receipt of these payments, characteristics of parents and families using them, and patterns of use. The main sources of data within PLIDA were DOMINO and the Censuses, with some ATO data used to capture information about income. This report covers receipt of these payments from each scheme's introduction up to December 2022.
9.1 Characteristics of PLP and DAPP recipients
The first research question for this project was 'what are the characteristics of PLP and DAPP recipients, and have these characteristics changed since the schemes' introductions?' This report has examined gender, family composition, educational attainment, whether Aboriginal and/or Torres Strait Islander, whether Australian-born, and some regional information.
Gender was clearly a key factor. The majority of PLP recipients were females, and the majority were living with a partner. Examination of other characteristics revealed that receipt of PLP was more likely for those cohorts of mothers that typically have a greater connection to employment. This, of course, is to be expected given that PLP is meant as a payment to support employment following a birth and is not relevant to those without a certain level of pre-birth employment. Those groups under-represented in the PLP recipients included single mothers, mothers with larger families, younger mothers, mothers with lower levels of educational attainment, and overseas-born and Aboriginal and/or Torres Strait Islander mothers.
As PLP can be taken by mothers while they are on paid leave from employment, take-up of PLP by mothers could not be used to ascertain which mothers might have access to employer-funded leave.
With regard to DAPP, almost all recipients were partnered males (98%). As for mothers, there were some differences in use of DAPP by some of the characteristics examined. DAPP differs from PLP in that it cannot be used while on employer-funded leave. Some findings, such as the relatively high incidence of fathers using DAPP who have certificate or diploma qualifications, may reflect that these fathers are likely to be in occupations or industries that have lesser access to paid parental leave.
There were only small differences in the characteristics of PLP and DAPP recipients over the years these payments have been available.
A key piece of information not incorporated into this analysis was income. While the incomes of PLP and DAPP recipients was explored, the analysis reported here did not include analysis of how pre-birth incomes were associated with take up of PLP or DAPP. Similarly, a very important factor is that of details of employment before the birth. Incorporating information on pre-birth employment will allow more focused analysis of the variation in take up among those that may have been eligible for PLP. Further work, linking ATO information to the Census and DOMINO data in PLIDA is planned and will allow exploration of these factors.
9.2 How families use PLP and DAPP
The second research question was 'How are families using PLP and DAPP - what can be said about the timing of use and how it varies in different families?'.
This analysis has focused on the timing of commencement on PLP and DAPP and of the duration on the payments, as well as some examination of couple-level patterns of use.
The analysis of commencement timing was hampered somewhat by the inability to derive the exact number of weeks between the birth and commencement on PLP and DAPP, due to the confidentialisation of birth dates. Approximations of timing of commencement were derived and grouped into months. The median timing of starting PLP was in the first month. The analysis did allow analysis of starting 'early' or starting later, and it was apparent that there were some differences. As with the 'take-up' analysis, differences were again found for those demographics typically associated with poorer labour market outcomes. Early commencement of PLP was more likely for younger mothers and those previously on low incomes, for example. While we have no data in PLIDA on employer-funded parental leave, it is likely that those starting PLP early are often those without other paid leave options. Mothers with paid leave options are able to take their PLP at any time, if eligible, but may prefer to delay the PLP receipt to the end of a period of employer-paid leave. The data on timing is consistent with this.
There is some indication that over the time since the introduction of PLP, mothers may be starting PLP later in recent years, which could indicate that more mothers have access to employer-funded leave, such that this paid leave is used more often before commencing on PLP.
As fathers cannot use DAPP while on employer-funded leave, and is for 2 weeks only, rather than the 18 weeks of PLP, there are some differences when compared to PLP. The median time of commencement was in the first month also, but there was little spread over subsequent months. Younger fathers and fathers with lower incomes were the most likely to start DAPP earlier. Like the mothers, these fathers could be expected to be more often in jobs that do not offer paid leave entitlements, such as paid parental leave, so starting DAPP early likely indicates that, for many, DAPP provides otherwise unavailable options to take time off work early after a birth.
Parents almost always used the full amount of PLP and DAPP. The analysis of duration on PLP showed that the distribution of time on PLP (derived as the elapsed time between start and finish of PLP) was extended beyond 18 weeks with the introduction of Flexible Paid Parental Leave for about 7-8 percent of PLP recipients. This suggested that some mothers were banking up some PLP for later use, although the data used to date did not provide insights on how Flexible PLP was being used. The analysis of parental characteristics associated with having a long duration on PLP, as a possible indicator of using Flexible PLP, indicated that as well as (previous) high-income recipient mothers more often using longer PLP, this was also apparent among young mothers and single mothers. Further analysis of the data is warranted to determine how Flexible PLP is being used, and to what extent some mothers do not end up using PLP they bank up for later use.
The exploration of use of PLP and DAPP also considered how these payments were being used within couple families.
One question of interest is to what extent parents shared PLP. The analysis found that PLP was only rarely shared, with the vast majority of PLP taken by the mother alone. In about one percent of couples, both parents received some of the PLP.
It was more common (from 2013) for parents to both be using PLP and DAPP, such that in 38% of the couple families with one parent receiving PLP, the other parent received DAPP. Mothers were least likely to have a partner taking DAPP if mothers were in the older age groups (35-39 years or more) or had incomes in the highest income ranges. This work could be extended further by more closely examining couples' combined incomes and also bringing in information on both mothers' and fathers' jobs and incomes before the birth. Further analysis could also explore those families that include the father using DAPP but the mother not using PLP. See further discussion of this in section 9.4.
The timing of PLP and DAPP receipt was examined within couples to see to what extent these payments were taken together or at different times. However, this analysis does not provide insights on to what extent each of a couple might be on any kind of leave at the same time given the data only relate to periods on PLP and DAPP. The findings reflect the relative timing of commencement on PLP and/or DAPP. As discussed above, the timing of commencement is likely related to what employer-funded leave options are available to each parent.
9.3 PLP and DAPP and other payments, all families with a child under one year's old
The final research question was 'To what extent is PLP (and DAPP) used across all families with children under one year of age, and if not PLP, what other financial supports are they accessing'.
The linked Census-DOMINO data allowed examination of this. At the 2016 Census, about 19% of mothers of under-one-year olds were receiving PLP. At the 2021 Census this percentage was higher, at 21%, after making an adjustment to exclude mothers who had an elapsed time on PLP of more than 18 weeks. The comparison of these proportions, also by age of child in months, indicated the increase was more among mothers of the older (under-one-year old) children.
In both Census years, the proportion of fathers using DAPP was around one percent. As DAPP is a 2-week payment compared to the 18 weeks for PLP, it would be expected that fewer fathers would be observed to be on DAPP at any point in time relative to mothers receiving PLP.
There were marked differences in the proportion of mothers using PLP according to the age, in months, of their child under one year of age. These differences were related to the employment patterns of mothers, with many away from work with the youngest under-one-year old children.
In 2016 and 2021, mothers were most likely to be receiving PLP when their youngest child was around 2-4 months old (40-44% of mothers receiving PLP) with 33% of mothers receiving PLP when their youngest child was up to 1 month old. The proportion of mothers receiving PLP was considerably lower from about the fifth month, but comparisons between 2016 and 2021 indicated there were more mothers receiving PLP in these later months in 2021. As mothers starting PLP later were likely doing so following a period of employer-funded leave, this higher proportion at later months in 2021 may have reflected the gradual growth in the availability of this leave.
Some of the parents who are not eligible for PLP receive other forms of financial assistance from the government, although note that some are not eligible due to having higher incomes, including as a result of having returned to work since the birth. Some will not be eligible because of having high incomes before the birth. Among those not receiving PLP, receipt of other DSS payments is more likely for single mothers than partnered mothers. These differences no doubt relate to differences in income levels of single and couple mothers who are not using PLP, with 21% of these single mothers receiving no DSS payments/allowances compared to 65% of these couple mothers.
Family Tax Benefit Part A may also be received by PLP recipients. Overall, 28% of mothers receiving PLP also received FTB Part A. That is, 72% of PLP recipients did not receive FTB Part A. The analysis of non-receipt of DSS payments, by child age in months, suggests that a large proportion of mothers receive PLP as their only form of (temporary) financial support from the government, and do not go on to other DSS payments once this PLP is concluded. Instead, many return to work and resume having employment income as their main source of income. The 'working' patterns of mothers, by age of child in months, shows the return-to-work patterns of mothers very clearly.
9.4 Implications for July 2023 changes
The analysis in this report was not specifically designed to consider possible outcomes of the July 2023 changes, so the reflections here are those that come out of the more general analysis of the pre-July 2023 patterns of PLP and DAPP use.
One of the changes introduced was the removal of DAPP, with fathers now to share PLP with the mother. Two extra weeks of PLP was added to the design, with these 2 weeks reserved for fathers (or another claimant) in couple families. Eligibility for fathers is subject to their meeting the eligibility criteria themselves, and also the mothers need to meet the work test for PLP.
Under the pre-July 2023 PLP arrangements, there has been little evidence of sharing of PLP by mothers, even though the design allowed for mothers to share some of the 18 weeks with someone else. We reported from this analysis that less than 1 per cent of children with a parent using PLP had more than one parent using PLP. Further, almost all mothers used all the 18 weeks of PLP. This indicates that while the new arrangements further support sharing of PLP between parents, significant changes may not be expected.
According to the analysis of couple-level use of PLP and DAPP, 25% of partnered DAPP recipients had a partner who did not use PLP. This suggests the changes may reduce access to paid leave for a group of fathers.32 However, we also note that under the new arrangements fathers can access PLP while on paid leave, which was not previously the case. Even considering that fathers may typically only take the 2 weeks of PLP that is reserved for them (or another claimant), the take up of this leave may increase among fathers as a top-up to paid leave arrangements.
The introduction of a family income test, for those that are ineligible for PLP because they have an income above the individual income test, is expected to increase access to PLP in some families. As the analysis in this report did not explore the incidence of PLP or DAPP use according to pre-birth incomes, it does not provide findings that are relevant to this change.
9.5 Key contributions, opportunities, limitations, next steps
The aim of this report was to fill a data gap about PLP and DAPP, to provide a range of information about receipt of these payments, and how the payments were used. To that end, the work has fulfilled that aim, providing a range of information for publication, such that it is accessible to researchers and others.
A useful contribution was the ability to analyse information about PLP and employment for mothers in the months after a birth. This month-level data is not typically available in national data collections and provides some new insights on the return-to-work patterns of mothers.
This research was limited by the variables available to this project in PLIDA and so could not explore some characteristics that might be of interest, for example, whether the baby was preterm, health and disability of parents or children, and residency status of migrant parents.
Clearly, an important aspect of understanding the use of PLP and DAPP, is understanding how or if they are used alongside employer-provided leave. Information on employer-provided leave was not available. The work undertaken to date also does not incorporate any information on pre-birth employment. This information matters not only in respect to eligibility for PLP and DAPP (the work test), but also matters in respect to likely access to employer-funded leave. Future work is planned that uses other linked data to explore some associations with job characteristics, with the intention of reporting about differences in use of PLP and DAPP for different segments of the labour market.
As indicated throughout this report, AIFS intends to continue to work with the PLP and DAPP data in PLIDA, to extend the analysis reported on here. It is proposed that a second report will focus more on the links between employment and PLP and DAPP.
32 It is unclear if the change will affect the full 25% of pre-July 2023 DAPP recipients as some of these may have had a partner who was eligible for PLP but elected not to use it. Further analysis of mothers' incomes and employment may provide some insights.
Bibliography
Australian Government Department of Social Services. (2015). Paid Parental Leave Scheme Review Report. Canberra: Department of Social Services.
Baird, M., Baxter, J.A., & Hamilton, M. (2023). Australia country note. In S. Blum, I. Dobrotić, G. Kaufman, A. Koslowski, & P. Moss. (2023). 19th International review of leave policies and related research 2023. doi: 10.25365/phaidra.431. Retrieved from
www.leavenetwork.org/annual-review-reports/review-2023/
Baxter, J. (2023). Employment patterns and trends for families with children. AIFS Research Report. Melbourne: AIFS
Martin, B., Baird, M., Brady, M., Broadway, B., Hewitt, B., Kalb, G. et al. (2015). PPL Evaluation Final Report. Canberra: Department of Social Services.
Qu, L., & Baxter, J. A. (2023a). Families and family composition. AIFS Families Facts and Figures. Melbourne: AIFS.
Qu, J., & Baxter, J. A. (2023b). Births in Australia. AIFS Families Facts and Figures. Melbourne: AIFS.
Appendix: Supplementary analysis
Derived PLP and DAPP percentages by age
| Child age (months) | 2016 % using PLP | 2021 % using PLP | 2021 % using PLP (adjusted) |
|---|---|---|---|
| 1 | 33.2 | 33.2 | 33.0 |
| 2 | 39.8 | 39.8 | 39.6 |
| 3 | 43.2 | 43.8 | 43.6 |
| 4 | 40.8 | 42.3 | 41.8 |
| 5 | 17.1 | 22.3 | 20.1 |
| 6 | 13.3 | 19.1 | 16.7 |
| 7 | 10.8 | 18.0 | 15.2 |
| 8 | 8.4 | 15.4 | 12.5 |
| 9 | 6.3 | 13.8 | 10.4 |
| 10 | 4.1 | 10.1 | 7.0 |
| 11 | 2.0 | 7.1 | 4.0 |
| All mothers of under-one-year-olds | 19.4 | 23.4 | 21.5 |
Notes: For the adjusted 2021 statistic, the indicator for PLP receipt for mothers who had been on PLP for more than 18 weeks has been reset to zero. Child age in months is approximate as it was derived from child birth date set to the first of the month for all children.
Source: PLIDA, DOMINO data update March 2023, linked to 2021 Census
Comparing the Census and DOMINO data in the linked file
The table below draws on the linked Census-DOMINO dataset for 2021, tabulating the Census-collected employment data by the linked DOMINO data for mothers.
| PLP and payment information derived from DOMINO | Employed, zero hours | Employed part time | Employed full time | Unemployed or NILF | Total |
|---|---|---|---|---|---|
| Counts | |||||
| Paid Parental Leave | 36,997 | 3,555 | 2,644 | 14,090 | 57,286 |
| No PLP but other payments | 10,417 | 12,810 | 3,511 | 57,333 | 84,071 |
| No DSS payments | 39,946 | 27,043 | 15,254 | 41,746 | 123,989 |
| Total | 87,360 | 43,408 | 21,409 | 113,169 | 265,346 |
| Percentage | |||||
| Paid Parental Leave | 42.4 | 8.2 | 12.4 | 12.5 | 21.6 |
| No PLP but other payments | 11.9 | 29.5 | 16.4 | 50.7 | 31.7 |
| No DSS payments | 45.7 | 62.3 | 71.3 | 36.9 | 46.7 |
| Total | 100.0 | 100.0 | 100.0 | 100.0 | 100.0 |
Notes: For the adjusted 2021 statistic, the indicator for PLP receipt for mothers who had been on PLP for more than 18 weeks has been reset to zero. Child age in months is approximate as it was derived from child birth date set to the first of the month for all children.
Source: PLIDA, DOMINO data update March 2023, linked to 2021 Census
Some observations are:
- Mothers reporting to have a job but to be working zero hours at the time of the Census were the most likely to be receiving PLP. In the Census data, this very likely reflects mothers being on some kind of parental leave, so accords with expectations.
- Some mothers were working part-time (less than 35 hours a week in all jobs) or full-time at the time of the Census but are recorded as receiving PLP. This may reflect that mothers have returned to work but have a period of PLP still to use, including those using PLP flexibly to facilitate a graduated return to work. It may also indicate that, in the Census, mothers reported their usual work hours (the hours they intend to work when returning to work, or the hours they worked before taking parental leave) rather than the hours they worked at the time of the Census.33
- Some mothers classified in the Census as unemployed or not in the labour force were identified as receiving PLP. To be classified as unemployed or not in the labour force, in the first question about employment, mothers will have indicated that they did not have a job the week before the Census. This suggests these mothers may not have intended to return to work or the same job following the period of PLP; that they considered they had left work. However, these mothers may have been in more casual employment, and may have sought employment again after a period of leave.
Regional differences in PLP/DAPP use
The analysis of regional information for PLP and DAPP recipients revealed no particular trends, and no particularly marked differences in distribution compared to that of new parents overall. Findings are therefore included in tables in the Appendix. This covers information on location (state and territory as well as remoteness).
| State/territory of residence | Mothers (Census) (%) | DAPP (DOMINO) (%) | ||
|---|---|---|---|---|
| 2016 | 2021 | 2016-17 | 2021-22 | |
| NSW | 31.9 | 32.3 | 31.8 | 31.6 |
| VIC | 25.8 | 26.0 | 26.1 | 26.0 |
| QLD | 19.6 | 19.6 | 19.7 | 20.0 |
| SA | 6.6 | 6.5 | 6.7 | 6.8 |
| WA | 11.2 | 10.8 | 10.5 | 10.5 |
| TAS | 1.9 | 1.9 | 1.9 | 1.9 |
| NT | 1.1 | 1.0 | 1.0 | 1.0 |
| ACT | 1.9 | 1.8 | 2.4 | 2.1 |
| Total | 100.0 | 100.0 | 100.0 | 100.0 |
Notes: DAPP recipient location was not available for a number of recipients. In particular the source information was not up-to-date to provide information for more recent recipients. This analysis excludes all missing data. When more up-to-date location data is available, these distributions may change somewhat.
Source: PLIDA, DOMINO data update March 2023
| State/territory of residence | Fathers (Census) (%) | DAPP (DOMINO) (%) | ||
|---|---|---|---|---|
| 2016 | 2021 | 2016-17 | 2021-22 | |
| NSW | 32.0 | 32.5 | 30.0 | 29.9 |
| VIC | 26.5 | 26.8 | 28.5 | 26.7 |
| QLD | 19.0 | 19.0 | 19.2 | 20.5 |
| SA | 6.6 | 6.4 | 7.5 | 7.7 |
| WA | 11.0 | 10.5 | 10.2 | 10.5 |
| TAS | 1.8 | 1.8 | 2.1 | 2.2 |
| NT | 1.1 | 1.1 | 0.7 | 0.8 |
| ACT | 1.9 | 1.9 | 1.7 | 1.7 |
| Total | 100.0 | 100.0 | 100.0 | 100.0 |
Notes: DAPP recipient location was not available for a number of recipients. In particular the source information was not up-to-date to provide information for more recent recipients. This analysis excludes all missing data. When more up-to-date location data is available, these distributions may change somewhat.
Source: PLIDA, DOMINO data update March 2023
| Remoteness area | Parents (Census) (%) | PLP (DOMINO) (%) | DAPP (DOMINO) (%) | |||
|---|---|---|---|---|---|---|
| Mothers 2016 | Fathers 2016 | 2016-17 | 2021-22 | 2016-17 | 2021-22 | |
| Major city areas | 73.6 | 74.9 | 76.6 | 75.0 | 77.8 | 75.0 |
| Inner regional areas | 16.4 | 15.6 | 15.0 | 16.1 | 15.0 | 16.8 |
| Outer regional areas | 7.9 | 7.4 | 6.9 | 7.3 | 6.2 | 6.9 |
| Remote and very remote | 2.2 | 2.1 | 1.5 | 1.6 | 1.1 | 1.2 |
| Total | 100.0 | 100.0 | 100.0 | 100.0 | 100.0 | 100.0 |
Notes: PLP and DAPP recipient location (and derived remoteness) was not available for a number of recipients. In particular the source information was not up to date to provide information for more recent recipients. This analysis excludes all missing data. When more up-to-date location data is available, these distributions may change. Remoteness was not available for the 2021 Census at the time this analysis was undertaken.
Source: PLIDA, DOMINO data update March 2023
Demographics, PLP and employment
| Characteristics | Employed, at work (%) | Employed, away from work (%) | Total employed (%) | Unemployed (%) | Not in labor force (%) | Total (%) |
|---|---|---|---|---|---|---|
| Relationship status | ||||||
| Female with male partner | 25.1 | 35.0 | 60.1 | 1.8 | 38.1 | 100.0 |
| Single female | 16.8 | 16.5 | 33.3 | 2.7 | 64.0 | 100.0 |
| Family size | ||||||
| 1 child | 23.8 | 37.7 | 61.5 | 1.9 | 36.6 | 100.0 |
| 2 children | 25.6 | 32.9 | 58.4 | 1.9 | 39.7 | 100.0 |
| 3 or more children | 22.4 | 22.4 | 44.8 | 1.9 | 53.4 | 100.0 |
| Age group | ||||||
| Under 25 | 16.5 | 15.1 | 31.5 | 3.3 | 65.2 | 100.0 |
| 25-29 | 22.8 | 29.5 | 52.3 | 2.2 | 45.5 | 100.0 |
| 30-34 | 24.8 | 37.0 | 61.8 | 1.7 | 36.6 | 100.0 |
| 35-39 | 26.0 | 36.9 | 62.9 | 1.5 | 35.6 | 100.0 |
| 40+ | 27.8 | 28.1 | 56.0 | 1.6 | 42.4 | 100.0 |
| Education | ||||||
| Incomplete secondary | 13.0 | 10.7 | 23.7 | 2.4 | 73.9 | 100.0 |
| Completed secondary only | 20.9 | 22.5 | 43.4 | 2.1 | 54.6 | 100.0 |
| Certificate / Diploma | 25.7 | 32.4 | 58.1 | 1.7 | 40.3 | 100.0 |
| Bachelor | 26.7 | 41.9 | 68.7 | 1.9 | 29.5 | 100.0 |
| Aboriginal and/or Torres Strait Islander | ||||||
| Non-Indigenous | 24.4 | 33.5 | 58.0 | 1.8 | 40.2 | 100.0 |
| Aboriginal and/or Torres Strait Islander | 16.9 | 18.5 | 35.5 | 2.9 | 61.7 | 100.0 |
| Country of birth | ||||||
| Born in Australia | 24.6 | 37.4 | 62.0 | 1.2 | 36.8 | 100.0 |
| Born outside of Australia | 23.4 | 25.2 | 48.6 | 3.0 | 48.4 | 100.0 |
| Language proficiency | ||||||
| Speaks English well or native English speaker | 24.6 | 33.8 | 58.3 | 1.9 | 39.8 | 100.0 |
| Does not speak English at all or not well | 8.9 | 4.3 | 13.2 | 2.5 | 84.3 | 100.0 |
| All | 24.2 | 32.9 | 57.1 | 1.9 | 41.0 | 100.0 |
Notes: Mothers with a same-sex partner were excluded due to small cell size. They were subsequently excluded from other analysis presented in this table.
Source: PLIDA, DOMINO data update March 2023
| Characteristics | PLP (with/ without other payments) (%) | Parenting/FTB Part B (%) | Other DSS payments (%) | No DSS payments (%) | Total (%) | Total number of mothers |
|---|---|---|---|---|---|---|
| Relationship status | ||||||
| Female with male partner | 24.7 | 21.5 | 5.1 | 48.7 | 100.0 | 235,265 |
| Single female | 13.1 | 66.4 | 2.6 | 17.9 | 100.0 | 29,720 |
| Family size | ||||||
| 1 child | 25.6 | 21.4 | 3.5 | 49.5 | 100.0 | 116,189 |
| 2 children | 23.9 | 25.1 | 4.7 | 46.3 | 100.0 | 97,124 |
| 3 or more children | 17.4 | 40.9 | 8.0 | 33.8 | 100.0 | 51,672 |
| Age group | ||||||
| Under 25 | 15.3 | 60.8 | 4.5 | 19.4 | 100.0 | 21,209 |
| 25-29 | 22.6 | 33.1 | 4.9 | 39.5 | 100.0 | 60,739 |
| 30-34 | 25.6 | 20.5 | 4.4 | 49.5 | 100.0 | 101,546 |
| 35-39 | 24.7 | 19.0 | 4.7 | 51.6 | 100.0 | 63,987 |
| 40+ | 18.6 | 25.0 | 7.8 | 48.6 | 100.0 | 17,504 |
| Education | ||||||
| Incomplete secondary | 9.8 | 64.4 | 5.3 | 20.6 | 100.0 | 23,877 |
| Completed secondary only | 19.4 | 37.9 | 5.6 | 37.1 | 100.0 | 35,097 |
| Certificate / Diploma | 25.5 | 30.6 | 5.9 | 38.0 | 100.0 | 82,280 |
| Bachelor | 26.4 | 11.4 | 3.7 | 58.6 | 100.0 | 113,245 |
| Aboriginal and/or Torres Strait Islander | ||||||
| Non-Indigenous | 23.8 | 25.2 | 4.8 | 46.3 | 100.0 | 254,536 |
| Aboriginal and/or Torres Strait Islander | 13.7 | 61.6 | 5.4 | 19.3 | 100.0 | 9,822 |
| Country of birth | ||||||
| Born in Australia | 26.1 | 28.4 | 5.1 | 40.4 | 100.0 | 167,763 |
| Born outside of Australia | 18.7 | 23.3 | 4.4 | 53.6 | 100.0 | 97,222 |
| Language proficiency | ||||||
| Speaks English well or native English speaker | 23.9 | 26.0 | 4.8 | 45.2 | 100.0 | 256,975 |
| Does not speak English at all or not well | 4.8 | 43.8 | 4.9 | 46.5 | 100.0 | 7,177 |
| All | 23.4 | 26.5 | 4.8 | 45.3 | 100.0 | 264,985 |
Notes: Mothers with a same-sex partner were excluded due to small cell size. They were subsequently excluded from other analysis presented in this table.
Source: PLIDA, DOMINO data update March 2023
Child-level numbers
| Financial year payment started | PLP only | PLP and DAPP | DAPP only | Total, PLP or DAPP received | PLP was used by more than one recipient (%) |
|---|---|---|---|---|---|
| 2010-11 | 47,572 | 0 | 0 | 47,572 | 0.4% |
| 2011-12 | 125,693 | 0 | 0 | 125,693 | 0.4% |
| 2012-13 | 111,981 | 25,243 | 11,164 | 148,388 | 0.3% |
| 2013-14 | 92,029 | 55,370 | 21,746 | 169,145 | 0.4% |
| 2014-15 | 106,137 | 55,290 | 17,887 | 179,314 | 0.3% |
| 2015-16 | 108,069 | 60,573 | 18,669 | 187,311 | 0.3% |
| 2016-17 | 106,171 | 62,555 | 19,622 | 188,348 | 0.3% |
| 2017-18 | 102,081 | 64,623 | 19,603 | 186,307 | 0.3% |
| 2018-19 | 102,135 | 69,936 | 19,754 | 191,825 | 0.3% |
| 2019-20 | 99,987 | 69,602 | 19,425 | 189,014 | 0.3% |
| 2020-21 | 101,750 | 72,417 | 20,070 | 194,237 | 0.6% |
| 2021-22 | 104,391 | 77,539 | 21,053 | 202,983 | 0.6% |
| 2022-23 (YTD) | 54,203 | 24,672 | 17,291 | 96,166 | 0.4% |
Note: 'Parent' includes other carers that received PLP or DAPP for this child.
Source: PLIDA, DOMINO data update March 2023
| Variable | Category | Odds ratios Timing of DAPP start (ref.=1st month) | |
|---|---|---|---|
| 2nd month | 3rd or later month | ||
| When started PLP | 2014-2015 | 0.98 | 1.14*** |
| (ref.= before 2014-15) | 2015-2016 | 0.83*** | 1.04*** |
| 2016-2017 | 0.74*** | 0.93*** | |
| 2017-2018 | 0.75*** | 0.97*** | |
| 2018-2019 | 0.71*** | 1.02* | |
| 2019-2020 | 0.68*** | 1.11*** | |
| 2020-2021 | 0.83*** | 1.36*** | |
| Partner | Partner (did not use DAPP) | 1.22*** | 1.73*** |
| (ref.=no partner) | Partner (did use DAPP) | 0.95*** | 1.33*** |
| Gender | Male (ref.=female) | 3.74*** | 7.91*** |
| Family size | 2nd | 1.09*** | 1.11*** |
| (ref.=1st) | 3rd | 1.07*** | 0.98** |
| Age group | 25-29 | 1.35*** | 2.24*** |
| (ref.=<25) | 30-34 | 1.65*** | 3.42*** |
| 35-39 | 1.81*** | 3.99*** | |
| 40+ | 1.97*** | 4.64*** | |
| Income previous year | $500-999 | 1.15*** | 1.55*** |
| (ref.=<$5000) | $1000-1499 | 1.46*** | 2.95*** |
| $1500-1999 | 1.74*** | 4.23*** | |
| $2000-2499 | 1.66*** | 3.55*** | |
| $2500+ | 1.69*** | 3.01*** | |
| Other | Australia-born (ref.=no) | 0.98** | 1.43*** |
| Aboriginal and/or Torres Strait Islander (ref.=no) | 0.93*** | 0.91*** | |
| Is multiple birth (ref.=no) | 1.36*** | 1.31*** | |
| Remoteness | Inner regional | 0.92*** | 0.90*** |
| (ref.=major | Outer regional | 0.95*** | 0.94*** |
| capital cities) | Remote or very remote | 1.09*** | 1.12*** |
| State/Territory | Vic | 1.09*** | 1.12*** |
| (ref.=NSW) | Qld | 0.84*** | 0.87*** |
| SA | 0.95*** | 0.99 | |
| WA | 0.90*** | 0.85*** | |
| Tas | 0.97 | 1.18*** | |
| NT | 1.07* | 1.07*** | |
| ACT | 1.04 | 1.62*** | |
| Constant | 0.12*** | 0.05*** | |
| Statistics | Number of observations | 1,634,172 | |
| Pseudo R-Square | 0.055 | ||
| Model degrees of freedom | 76 | ||
Notes: Population was all PLP recipients starting before 2021-22. Later years were excluded due to excessive missing data for income and location. Categories not shown in output are indicators for missing values for income, whether Aboriginal and/or Torres Strait Islander, remoteness and state. *p < 0.05; **p < 0.01; ***p < 0.001
| Variable | Category | Odds ratios Timing of DAPP start (ref =1st month) | |
|---|---|---|---|
| 2nd month | 3rd or later month | ||
| When started DAPP (ref.= before 2014-15) | 2014-2015 | 0.97* | 1.41*** |
| 2015-2016 | 0.90*** | 1.24*** | |
| 2016-2017 | 0.83*** | 1.20*** | |
| 2017-2018 | 0.87*** | 1.12*** | |
| 2018-2019 | 0.88*** | 1.10*** | |
| 2019-2020 | 0.91*** | 1.17*** | |
| 2020-2021 | 1.00 | 1.09*** | |
| Partner (ref.=no partner) | Partner (did not use PLP) | 1.14*** | 0.90*** |
| Partner (did use PLP) | 1.23*** | 1.01 | |
| Gender Family size (ref.=1st) | Male (ref=female) | 0.52*** | 0.67*** |
| 2nd | 0.95*** | 0.82*** | |
| 3rd | 0.92*** | 0.77*** | |
| Age group (ref.=<25) | 25-29 | 1.13*** | 1.29*** |
| 30-34 | 1.32*** | 1.83*** | |
| 35-39 | 1.48*** | 2.27*** | |
| 40+ | 1.58*** | 2.52*** | |
| Income previous year (ref.=<$5000) | $500-999 | 1.49*** | 1.19*** |
| $1000-1499 | 2.01*** | 1.31*** | |
| $1500-1999 | 2.27*** | 1.47*** | |
| $2000-2499 | 2.24*** | 1.47*** | |
| $2500+ | 2.06*** | 1.41*** | |
| Other | Australia-born (ref.=no) | 1.06*** | 0.85*** |
| Aboriginal and/or Torres Strait Islander (ref.=no) | 1.00 | 0.98 | |
| Is multiple birth (ref.=no) | 1.92*** | 1.85*** | |
| Remoteness (ref.=major capital cities) State/Territory (ref.=NSW) | Inner regional | 0.97* | 1.09*** |
| Outer regional | 0.95** | 1.12*** | |
| Remote or very remote | 0.80*** | 1.01 | |
| Vic | 0.98* | 0.94*** | |
| Qld | 1.03** | 0.94*** | |
| SA | 1.12*** | 1.04* | |
| WA | 0.94*** | 0.83*** | |
| Tas | 1.37*** | 1.11*** | |
| NT | 1.33*** | 1.12** | |
| ACT | 1.63*** | 1.75*** | |
| Constant Statistics | 1.25*** | 0.46*** | |
| Number of observations | 666,056 | ||
| Pseudo R-Square | 0.008 | ||
| Model degrees of freedom | 114 | ||
Notes: Population was all DAPP recipients starting before 2021-22. Later years were excluded due to excessive missing data for income and location. Categories not shown in output are indicators for missing values for income, whether Aboriginal and/or Torres Strait Islander, remoteness and state. *p < 0.05; **p < 0.01; ***p < 0.001
| Variable | Category | Odds ratio PLP duration >18 weeks (reference = <=18 weeks) |
|---|---|---|
| Partner (ref.=no partner) | Partner (did not use PLP) | 0.72*** |
| Partner (did use PLP) | 7.38*** | |
| Partner (did not use DAPP) | 1.04* | |
| Gender Family size (ref.=1st) | Male (ref=female) | 0.72*** |
| 2nd | 1.13*** | |
| 3rd | 1.24*** | |
| Age group (ref.=<25) | 25-29 | 0.79*** |
| 30-34 | 0.72*** | |
| 35-39 | 0.73*** | |
| 40+ | 0.76*** | |
| Income previous year (ref.=<$5000) | $500-999 | 0.89*** |
| $1000-1499 | 0.94 | |
| $1500-1999 | 1.14*** | |
| $2000-2499 | 1.20*** | |
| $2500+ | 1.40*** | |
| Other | Australia-born (ref.=no) | 0.89*** |
| Aboriginal and/or Torres Strait Islander (ref.=no) | 1.29*** | |
| Is multiple birth (ref.=no) | 0.78* | |
| Remoteness (ref.=major capital cities) State/Territory(ref.=NSW) | Inner regional | 1.01 |
| Outer regional | 1.12** | |
| Remote or very remote | 0.98 | |
| Vic | 0.99 | |
| Qld | 1.01 | |
| SA | 0.88** | |
| WA | 0.96 | |
| Tas | 0.98 | |
| NT | 1.07 | |
| ACT | 0.97 | |
| Constant | 0.12*** | |
| Statistics | Number of observations | 173,037 |
| Pseudo R-Square | 0.023 | |
| Model degrees of freedom | 32 |
Notes: Population was all PLP recipients starting in 2021-22. Later years were excluded due to excessive missing data for income and location. This applies to take up of Flexible Parental Leave that was introduced in July 2020, so it is not relevant to explore for earlier years. Categories not shown in output are indicators for missing values for income, whether Aboriginal and/or Torres Strait Islander, remoteness and state. *p < 0.05; **p < 0.01; ***p < 0.001
| Variable | Category | Odds ratio Partner used DAPP (reference=partner did not use DAPP) |
|---|---|---|
| When started DAPP (ref.= before 2014-15) | 2014-2015 | 0.87*** |
| 2015-2016 | 0.94*** | |
| 2016-2017 | 1 | |
| 2017-2018 | 1.07*** | |
| 2018-2019 | 1.18*** | |
| 2019-2020 | 1.22*** | |
| 2020-2021 | 1.23*** | |
| Gender Family size (ref.=1st) | Male (ref=female) | 0.03*** |
| 2nd | 0.83*** | |
| 3rd | 0.62*** | |
| Age group (ref.=<25) | 25-29 | 1.17*** |
| 30-34 | 1.07*** | |
| 35-39 | 0.89*** | |
| 40+ | 0.74*** | |
| Income previous year (ref.=<$5000) | $500-999 | 0.99* |
| $1000-1499 | 0.99* | |
| $1500-1999 | 0.88*** | |
| $2000-2499 | 0.76*** | |
| $2500+ | 0.59*** | |
| Other | Australia-born (ref.=no) | 0.83*** |
| Aboriginal and/or Torres Strait Islander (ref.=no) | 0.90*** | |
| Is multiple birth (ref.=no) | 0.62*** | |
| Remoteness (ref.=major capital cities) | Inner regional | 1.08*** |
| Outer regional | 0.86*** | |
| Remote or very remote | 0.61*** | |
| State/Territory (ref.=NSW) | Vic | 1.21*** |
| Qld | 1.12*** | |
| SA | 1.48*** | |
| WA | 0.96*** | |
| Tas | 1.50*** | |
| NT | 0.83*** | |
| ACT | 0.86*** | |
| Constant | 0.75*** | |
| Statistics | Number of observations | 1,265,466 |
| Pseudo R-Square | 0.02 | |
| Model degrees of freedom | 36 |
Notes: Population was all partnered PLP recipients starting after 2013-14 (DAPP was introduced in 2014) and before 2021-22. Later years were excluded due to excessive missing data for income and location. Categories not shown in output are indicators for missing values for income, whether Aboriginal and/or Torres Strait Islander, remoteness and state . *p < 0.05; **p < 0.01; ***p < 0.001
33 In the Census, employed people are asked the number of hours worked in all jobs held during the week prior to Census night. They are asked to subtract any time off but add overtime and extra time worked.
© GettyImages/Edwin Tan
Baxter, J., & Budinski, M. (2023). Parental Leave Pay and Dad and Partner Pay: Patterns of use. Analysis using the Person Level Integrated Dataset (PLIDA). Melbourne: Australian Institute of Family Studies.
978-1-76016-313-6