Costs and affordability of child care
June 2023
Download Research snapshot
Overview
This snapshot presents findings from the 2018–2021 evaluation of the Australian Government's Child Care Package.
A key objective of the Child Care Package was to improve affordability, especially for low- and middle-income families, and to address increasing costs of child care.1 In addressing this objective, the policy design was also expected to increase costs for higher income families. This snapshot provides an overview of the aspects of the Child Care Package that impact on the cost of care to families, and reports on some of the findings related to affordability. See also the snapshot on child care fees.
Families' child care costs under the Child Care Package
How much families pay for child care is the difference between the total fee charged by the child care provider and the amount of subsidy paid to the service for each child. The total fee charged will vary with the amount of child care used, and also will vary across and within services given variable service fees (fees are set by child care providers and vary by service type and location; for examples see the child care fees snapshot).
The subsidy amount is, for most families, the amount of Child Care Subsidy (CCS), although some families covered by the Child Care Safety Net will have a higher subsidy amount through the Additional Child Care Subsidy (ACCS).2 The CCS has four components that determine the amount of subsidy:
- hourly rate caps designed to limit the hourly fee charged by child care providers and used to calculate the CCS. There are different hourly rate caps for different service types.
- No amount of CCS is payable for the portion of the hourly fee charged above the hourly rate cap.
- the percentage rate of CCS families are eligible for, dependent on family income. The subsidy rate is highest, at 85%, for low-income families, and then is tapered, in stages, as family income increases. The subsidy rate applies to the fee charged, up to the hourly rate cap.
- That is, if a service is charging above the hourly rate cap, a family on 85% subsidy will be entitled to 85% of the hourly rate cap, rather than 85% of the total hourly fee charged.
- allowed hours as determined by the activity test. The subsidy rate will be applied to the number of hours families are entitled to have subsidised. This is determined by the activity test. There are exemptions to the activity requirements in certain circumstances.
- If a child is enrolled in care for more hours per fortnight than their allowed hours, some of the hours charged will not be subsidised.
- the annual cap, the maximum amount of CCS that will be paid to a family in any one financial year. For 2019-20 it was $10,373 per child per annum and applied to families with a joint annual income over $188,163 and less than $352,453.
- The annual subsidy cap only impacts a small number of families (about 14,500 in 2018-19).
Also, to help families avoid being overpaid CCS due to underestimating their annual adjusted taxable income and incurring a debt, 5% of the CCS is withheld throughout the year by Centrelink. This means that 95% of the amount of CCS families are entitled to goes to the service each fortnight, with families paying the balance. After the end-of-financial-year reconciliation, the final entitlement of CCS for the year is recalculated using the family's actual adjusted taxable income for the year. The difference between the actual entitlement and the 95% amount paid out during the year is paid to the family. If a family has overestimated their income, resulting in too little CCS being paid, then the additional CCS amount will be paid to the family. If the family has underestimated their annual adjusted taxable income, then the 5% withheld amount will be used to reduce any debt and any remainder paid to the family.
Subsidy rates and annual cap
As noted above, the subsidy rate is one of the inputs that determines child care costs. See Figure 1 for the 2018-19 subsidy rates (and 2019-20 subsidy rates in the figure note).
Figure 1: Child Care Subsidy, Rate of subsidy by family income, 2019-2020
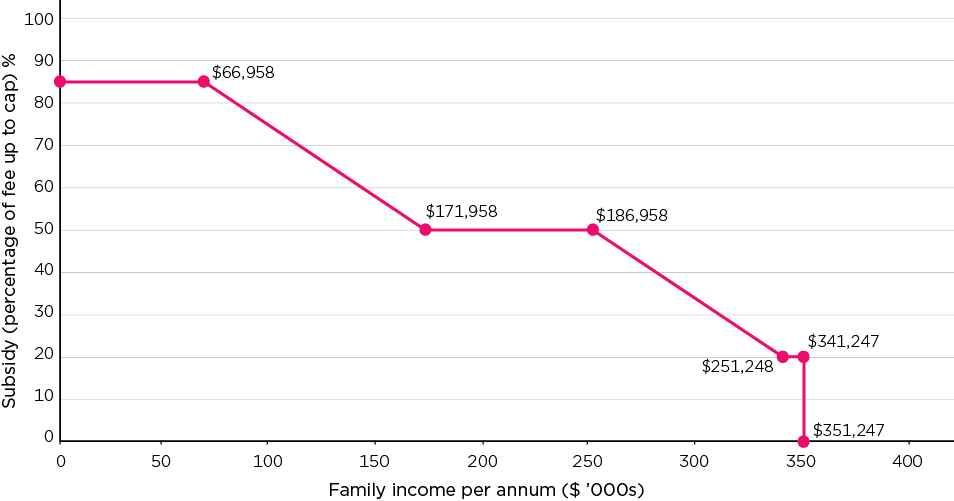
Note: Income cut-offs shown are those that applied in 2018-19. In 2019-20 the cut-offs were, in order, $68,163, $173,163, $252,453, $342,453 and $352,453.
In terms of the numbers of families who are entitled to the different subsidy amounts:
- The largest group is that of families with incomes 'over $66,958 to $171,958', representing 48% of families.
- More than a quarter of families (28%) have incomes in the lower income range, up to $66,958.
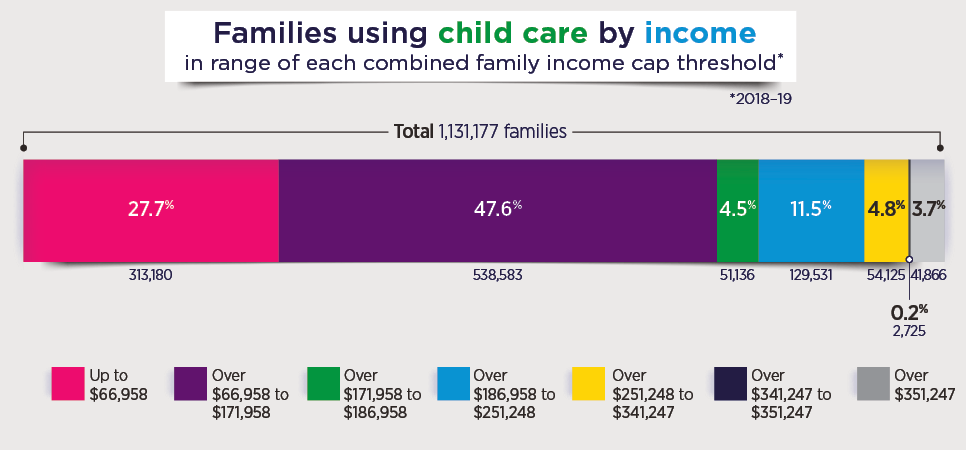
Source: DESE administrative data
For child care hours that are subsidised, parents need to pay the balance that remains after the subsidy percentage is applied to the fees (or the hourly rate cap, if fees are higher than the cap) and after the withholding percentage. Parents pay 100% of the cost of unsubsidised hours.
Subsidised hours
The family activity test determines how many hours of care will be subsidised. When families use more than their subsidised hours, they are charged the full fee for the balance of hours not subsidised. See the activity test snapshot for more information.
In 2018-19, 13% of child care hours paid for were unsubsidised and 53% of families using child care had some unsubsidised hours. Much of the volume of unsubsidised hours relates to people without CCS. But there is a level of unsubsidised hours of care across the whole income distribution, including those on low income, and across the bands of approved hours.
As an example, using data for the first fortnight of October 2019, 6% of children were charged for more hours of child care than would be subsidised according to their activity test result.
- Most children with access to 72 or 100 subsidised hours per fortnight had all their hours of child care subsidised. Those most likely to be using more child care than their subsidised hours are children with access to zero, 24 or 36 hours of subsidised care per fortnight.
Proportion of total fees subsidised
The above factors (subsidy percentage, fees charged and number of subsidised hours) determine how much parents pay for child care, relative to how much is subsidised.
Figure 2 shows the distribution of the proportion of families' child care fees that were subsidised. Findings are compared for one week in 2017, before the Child Care Package, to similar periods in 2018 and 2019.
- Prior to the introduction of the Package, most families had between 50% and 75% of their child care fees subsidised.
- Following the introduction of the Package, a larger proportion of families have between 75% and 95% of their child care fees subsidised (increasing from 17% in 2017 to 33% in 2019); however, there is a similar sized increase in families receiving none or less than 50% of their child care fees in subsidy (4% in 2017 to 21% in 2019).
Similar findings are apparent for other reference periods. However, since July 2018, there is variation week-to-week in the proportion of care subsidised, which reflects the fortnightly payment structure of CCS, with families who use more than their allowed hours of care having all hours subsidised in week 1, and 'running out' of hours in week 2, requiring full fees for the remaining care used.
Figure 2: Actual weekly Child Care Subsidy rate received by families, selected week in 2017, 2018 and 2019
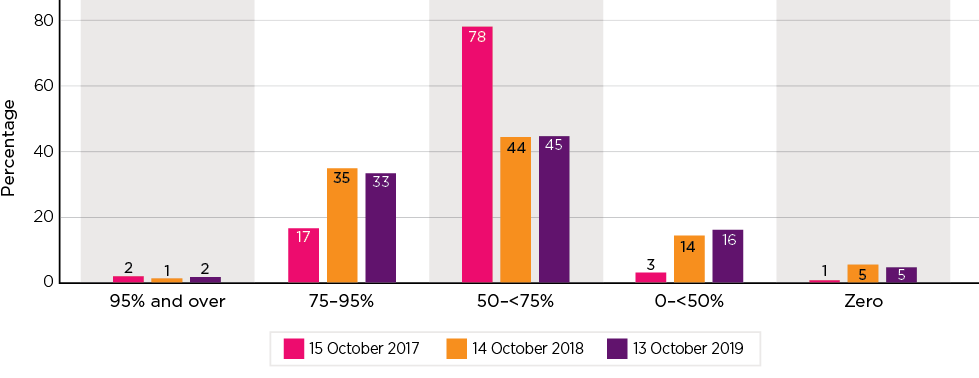
Notes: Uses unreconciled estimate of weekly subsidy.
Source: DESE administrative data
Modelling results
For the evaluation of the Child Care Package, the impact on affordability was assessed primarily through using 'static' microsimulation modelling, which assessed whether child care under the new CCS is more affordable than it was under the former Child Care Benefit/Child Care Rebate (CCB/CCR). This modelling focuses just on the impact of the new funding arrangements, relative to the former funding model, to understand how this has affected different families. It does not take account of the impact of the policy on fees (which, as reported in the snapshot Child care fees charged by services have continued to rise) nor changes in child care use.
The modelling used the 2018-19 population of child care users and estimated, using their actual 2018-19 fees, income and usage, the value of assistance under the CCS and what they would have received under the old subsidies. Overall, it found:
- The mean annual net cost of child care reduced from $4,875 under CCB/CCR to $4,394 under CCS, and as a percentage of gross family income the Child Care Package is estimated to have reduced costs from 5.2% to 4.1%.
- The median annual net cost of child care was reduced by the Child Care Package from $2,957 to $2,507, or from 3.0% to 2.7% of gross family income.
Analysis of changes in child care costs due to the Child Care Package, using this modelling, found:
- almost two-thirds of families (62% or about 686,000 families) had lower net costs under CCS
- almost one-in-ten families (9% or about 95,000 families) had more or less the same net costs
- three-in-ten (29% or about 323,000 families) had higher net costs under CCS than under CCB/CCR.
For those with a reduced cost under the CCS, the average proportion of gross income spent on child care fell from 6.7% to 4.5%, with annual net spending falling from $5,412 to $4,026. The median cost fell from 4.4% of gross family income to 3.2%, and actual spending from $3,472 to $2,436. In contrast, for the 29% of families with higher net costs under CCS, the average proportion of gross income spent on child care rose, from 2.9% to 4.0%, with net actual spending increasing from $4,043 to $5,304.
The modelling indicated that gains in child care costs related to the Child Care Package were greatest for low-income families, families with larger numbers of children using child care, for those using longer periods of care and for those using for-profit Family Day Care. Once controlled for family characteristics there were no strong regional effects.
Figure 3 shows modelling results for families on different incomes, from the lowest to the highest incomes. It compares the median net child care costs, as a percentage of income, under the CCS and under the CCB/CCR. Overall, lower income families spend a higher proportion of their income on child care than high-income families. Under the CCS, though, costs as a proportion of income are less for low- to middle-income families. In contrast, under the CCS, cost as a proportion of income is higher for families with incomes in the top 25% of incomes (vigintiles 16 to 20).
That is, while lower income families still spend a higher proportion of their income on child care than high-income families, they are better off under the CCS.
Figure 3: Median net child care costs as a percentage of gross family income under CCB/CCR and CCS, by family gross income vigintile, 2018-19
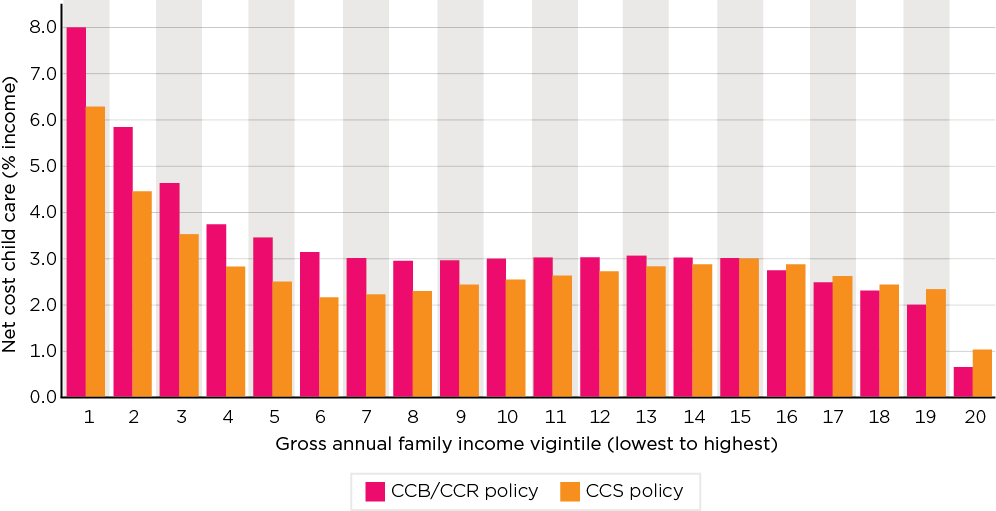
Notes: The income vigintiles are categories of family income from lowest income to highest income, with each category representing the family income of about 5% of the population. The lowest vigintile reflects annual gross family incomes of less than $21,000 and the highest reflects incomes of $308,189 or more. The 15th vigintile, where the change in net costs is zero, is $157,355-<$170,948 and the 16th vigintile refers to incomes of $170,948-$187,648.
Source: Evaluation modelling using 2018-19 administrative database file assuming constant 2018-19 child care costs and usage
Parental views on affordability
Another approach to measuring the impact of the Child Care Package on the affordability of child care was to draw on parents' assessments and perceptions of child care affordability.
The findings presented come from four waves of the DESE/ORIMA Parent Surveys.3 Parents were asked to rate their agreement with the statement 'The cost of child care is affordable' in each of the surveys, one immediately before the introduction of the package and three following the introduction of the package in November 2018, June 2019 and November 2019.
If responses, at each survey, are coded from 'strongly disagree' to 'strongly agree' as -2 through to +2, and the averages taken of these responses, in general, parents were more likely to agree with this statement after the Package was introduced, as seen in a higher mean score in the November 2018, June 2019 and November 2019 surveys. See Figure 4.
While the Child Care Package made child care more affordable, there is, though, still considerable negativity about the overall affordability of child care in November 2019.
- Of parents with a child aged 0-4 years, 55% disagreed that child care was affordable, 28% agreed that child care was affordable, and 17% neither agreed nor disagreed.
- For those with a youngest child aged 5-13 years, 41% disagreed child care was affordable and 39% agreed, with 20% neither agreeing nor disagreeing.
Figure 4: Parents' agreement that child care is affordable, by child age group, mean rating, June 2018-November 2019
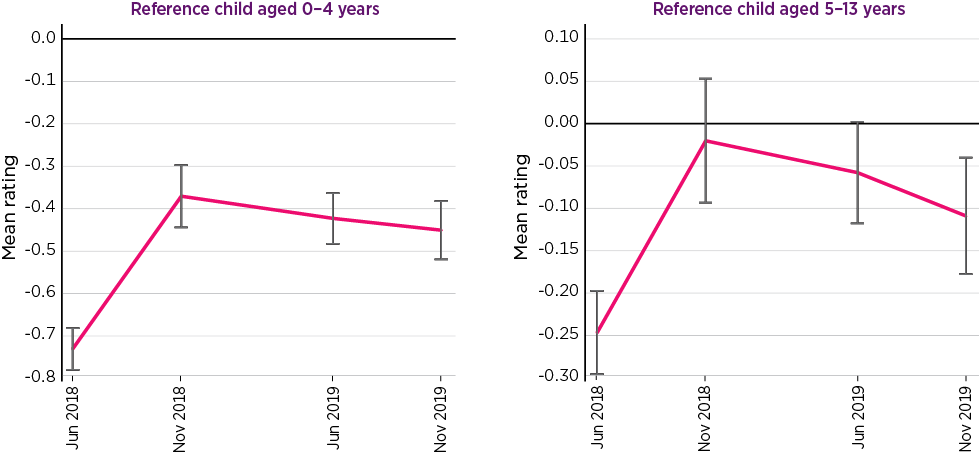
Notes: Parents with a reference child who is in identifiable formal child care. Responses scored: 'Strongly agree': +2; 'Agree': +1; 'Neither agree nor disagree': 0; 'Disagree': -1; 'Strongly disagree': -2.
Source: DESE/ORIMA Parent Survey, June 2018 to November 2019
The June 2019 Parent Survey asked families who were using child care specifically about whether they were financially better off under the CCS compared to the old system:
- 31% agreed that they were better off (6% strongly agreed and 25% agreed)
- almost half (46%) of parents with a child in child care neither agreed nor disagreed
- one in four disagreed (14% disagreed and 10% strongly disagreed).
Those in lower income households were more likely to agree that they were better off under the CCS compared to those from higher income households. See Figure 5.
Figure 5: Parents' agreement with 'I am better off under the new CCS than under the old CCB/CCR', by gross family income, November 2019
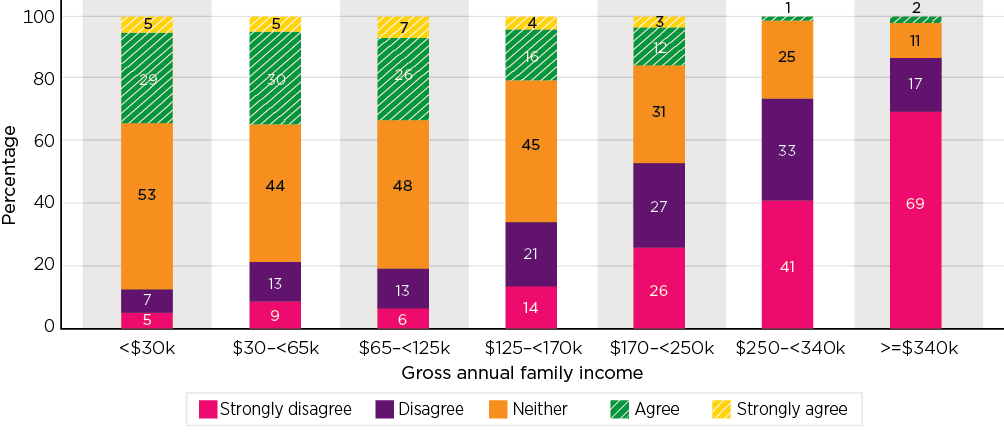
Notes: Population restricted to those who used paid child care prior to 2 July 2018.
Source: DESE/ORIMA Parent Survey, June 2018 and November 2019
The Consumer Price Index (CPI) and costs of child care
Another perspective on child care costs reported in the evaluation uses the Australian Bureau of Statistics' (ABS) Consumer Price Index (CPI) that tracks the cost of child care, taking total child care prices and subtracting government subsidies. Figure 6 shows costs of child care have risen over time, with the effects of both the cost of labour, which has risen more steeply than prices overall, and, in some periods, changes in the regulatory framework. Adjustments to subsidies and introducing new programs have typically been associated with strong falls in costs to parents in the short term.
Figure 6: ABS Child Care and All Groups CPI, March 1982 to March 2020
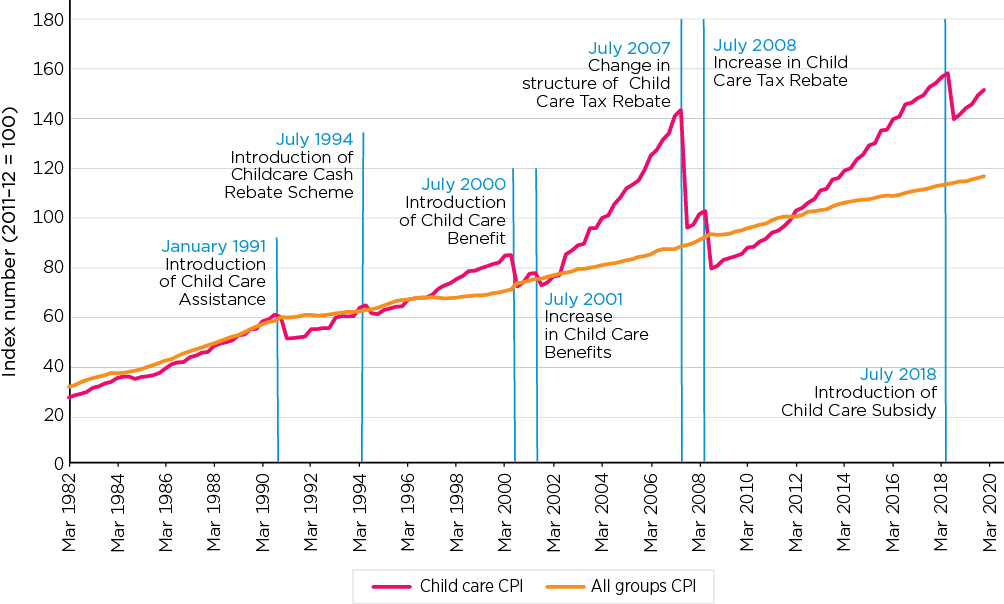
Source: ABS (various years). 'Consumer Price Index, Australia', ABS Catalogue No. 6401.0, ABS, Canberra.
- In regard to the impact of the Child Care Package and the replacement of the CCB/CCR with the CCS, the ABS reported this resulted in a 12% decline in the cost of child care in September 2018.
- Child care costs to parents have increased at a faster rate than the overall CPI since June 2018. By March 2020 almost three-quarters of the reduction in the child care CPI had been lost. Analysis over time suggests that the net cost of child care to families as a proportion of average earnings at the end of 2019 was little different to that in 1982, notwithstanding the initial introduction of child care assistance and subsequent policies directed at augmenting this.
Summary
The Child Care Package has had an overall positive impact on affordability - delivering a significant benefit to lower and middle-income families, with higher income families having to shoulder a higher proportion of their child care costs. This is consistent with the objectives of the policy. It is estimated that the CCS reduced the net cost of child care for 62% of families using child care when compared with previous funding arrangements. For these families, the average proportion of gross income spent on child care fell from 6.7 per cent to 4.5 per cent, with annual net spending falling from $5,412 to $4,026. For the 29% of families that saw an increase in costs under the Package, the average proportion of gross income spent on child care rose from 2.9% to 4.0%.
Child Care Package evaluation
In July 2018 the Australian Government introduced the Child Care Package. The Australian Institute of Family Studies in association with the Social Research Centre, the UNSW Social Policy Research Centre and the ANU Centre for Social Research and Methods were commissioned by the Australian Government Department of Education, Skills and Employment to undertake an independent evaluation of the new Child Care Package. Findings presented here are based on data collected and analysed for the Child Care Package evaluation. The evaluation commenced in December 2017 prior to the introduction of the Package and reported on data collected up to December 2019. The evaluation was impacted by external events, particularly COVID-19, which resulted in the suspension of the child care funding system for a period during 2020. As a result, the evaluation only draws on data to the end of 2019 and does not include data from 2020.
1 The policy settings described in this snapshot refer to those that applied at the time of the evaluation. There have been some updates to the policy settings since this time, and the Department of Education, Skills and Employment (DESE) is now the Department of Education.
2 The ACCS is a top-up payment to the CCS. It provides additional fee assistance to families and children facing barriers in accessing affordable child care. Costs of care for those on the ACCS is not covered in this snapshot.
3 This data was collected in the DESE/ORIMA Parent Surveys, which were managed and designed by the Department and conducted on the Department's behalf by ORIMA Research. Results were provided to the evaluation as the main source of data on parents' experience and views. The surveys were conducted twice-yearly from June 2018, and in all but the November 2019 survey included a sample of parents not using child care. We refer to respondents as parents but a small number were grandparents or other carers.
Australian Institute of Family Studies. (2023). The 2018–2021 Child Care Package Evaluation: Costs and affordability of child care. (Findings from the Child Care Package evaluation). Melbourne: Australian Institute of Family Studies.