Regular online betting in Australia, 2022
National Gambling Trends Study
October 2023
Nancy Greer, Rebecca Jenkinson, Brian Vandenberg, Kei Sakata
Download Research snapshot
Overview
This research summary presents findings from a 2022 survey of Australian adults (n = 955) who bet online on sports/races (also known as online wagering) on a regular basis (at least fortnightly). The survey examined gambling behaviour and experiences in the past 12 months.
Key messages
-
Two in three participants (68.4%) who regularly bet online on sports/races were classified as being at risk of gambling harm, with younger age groups (18-34 years; 81.9%) at highest risk.
-
Most participants spent money betting on horse racing (91%) and sports (86.7%), followed by gambling on lotteries (81.7%) and poker machines/'pokies' (67.6%).
-
Participants spent around $768 per month (median) across all types of gambling, including $125 on horse racing and $80 on sports, with over 1 in 4 (26.7%) reporting using credit cards to gamble.
-
Median monthly expenditure on gambling activities was higher for men and the younger age group (18-34 years).
-
Participants' most recent session of online betting lasted 2.5 hours on average (median) and almost two-thirds (63.0%) reported that they had gambled alone.
-
More than half (55.1%) reported having multiple online betting accounts and 13.3% had used an offshore (illegal) online betting account during the past 12 months.
-
Only a minority (6.3%) of regular online bettors reported seeking help for gambling harm (in the past year). The most common reasons reported for not seeking help were embarrassment (46.5%) and not thinking help would change their gambling (23.8%).
-
Participants classified as being at risk of gambling harm:
- spent more per month on sports betting ($100 compared to $50 not at risk) and pokies ($88 compared to $15 not at risk) and across all gambling activities ($1,283 compared to $352 not at risk)
- gambled longer for their most recent online betting session (4.5 hours compared to 2.5 hours not at risk)
- gambled in the late-night hours of midnight to 8 am during their most recent online betting session (33.5% compared to 19.2% not at risk)
- met criteria for probable serious mental illness (5.5% compared to 0.7% not at risk)
- sought help in the past year for gambling harm (9.0% compared to 0.3% not at risk) or wanted to seek help but didn't (15.2% compared to 0.7% not at risk).
About the National Gambling Trends Study
Purpose
This is the first release of the National Gambling Trends Study (NGTS) findings, which will be produced annually by the Australian Gambling Research Centre (AGRC) at the Australian Institute of Family Studies (AIFS). The aim of the NGTS is to present timely information on recent trends, emerging issues and possible future directions in gambling participation and related harms in Australia. The information is relevant for gambling policy makers and regulators, service providers, researchers and the broader community. A long-term goal of the NGTS is to support the development and implementation of evidence-based approaches to prevent and reduce gambling-related harm in Australia.
Methods
The NGTS uses mixed-methods research, drawing on data from different sources to increase robustness and reliability. The current release is based on a consumer survey conducted online during July-November 2022 with people who bet online on sports or races (also known as online wagering) on a regular basis (at least fortnightly) (N = 955).
Reports
This research summary is 2 of 3 published for the 2022 edition of the NGTS. The full suite includes:
- Regular pokies gambling in Australia, 2022
- Regular online betting in Australia, 2022
- Consumer views on emerging trends and future directions for gambling in Australia, 2022.
Sample characteristics
A convenience sample of Australian adults who bet online on sports or races (e.g. using a mobile phone, tablet, computer) on a regularly basis (at least fortnightly in the previous 3 months) were recruited during July-November 2022 and completed an online survey regarding their demographic characteristics, gambling behaviour (frequency, spend, mode, location, payment methods used, risks and harm), most recent online betting session, alcohol use and smoking, health and wellbeing, help-seeking, and use of harm minimisation tools. Median survey duration was 18 minutes.
| Number of survey participants | % (N = 955) |
|---|---|
| State/Territory | |
| New South Wales | 34.9 |
| Victoria | 25.5 |
| Queensland | 19.0 |
| South Australia | 8.3 |
| Western Australia | 9.8 |
| Tasmania | 1.7 |
| Australian Capital Territory | 0.8 |
| Northern Territory | 0.0 |
| Age | |
| 18-24 years | 8.1 |
| 25-34 years | 22.0 |
| 35-49 years | 32.0 |
| 50-59 years | 15.9 |
| 60-64 years | 7.6 |
| 65+ years | 14.3 |
| Mean age (years) | 45.2 |
| Gender | |
| Men | 52.8 |
| Women | 46.7 |
| Non-binary | 0.3 |
| Not answered | 0.3 |
| Birthplace, ancestry and language | |
| Australian born | 83.0 |
| Aboriginal and/or Torres Strait Islander | 4.4 |
| Speaks language other than English at home | 11.9 |
| Relationship and household status | |
| In a relationship/married/de facto | 68.4 |
| Lives with other people | 81.8 |
| Location | |
| Lives in a major city | 79.2 |
| Lives outside a major city | 20.8 |
| Education, employment and income | |
| Bachelor's degree or higher | 40.1 |
| Currently studying | 24.3 |
| Currently employed | 75.1 |
| Median weekly income (AUD$) | 1,000-1,249 |
Gambling participation
Past-year gambling
Among Australian adults who reported regularly betting online, the majority reported betting on horse racing (91.0%) and sports events (86.7%) in the past year (see Figure 1). Four in five reported also gambling on lotto/lottery games (81.7%), and two-thirds reported also gambling on pokies (67.6%). More than half reported gambling on greyhound racing (60.8%), instant scratch tickets ('scratchies') (60.7%) and harness racing (53.4%). Overall, those participating in regular online gambling reported an average of 8 different gambling activities in the past year.
Among the 86.7% of regular online gamblers who reported betting on sports, the most popular types of sports bet on included: Australian Rules Football (AFL) (58.5%), National Ruby League (NRL) (49.0%), soccer (28.5%), cricket (27.4%), basketball (25.1%) and tennis (24.2%).
Figure 1: Past-year gambling participation by type of gambling activity among regular online bettors
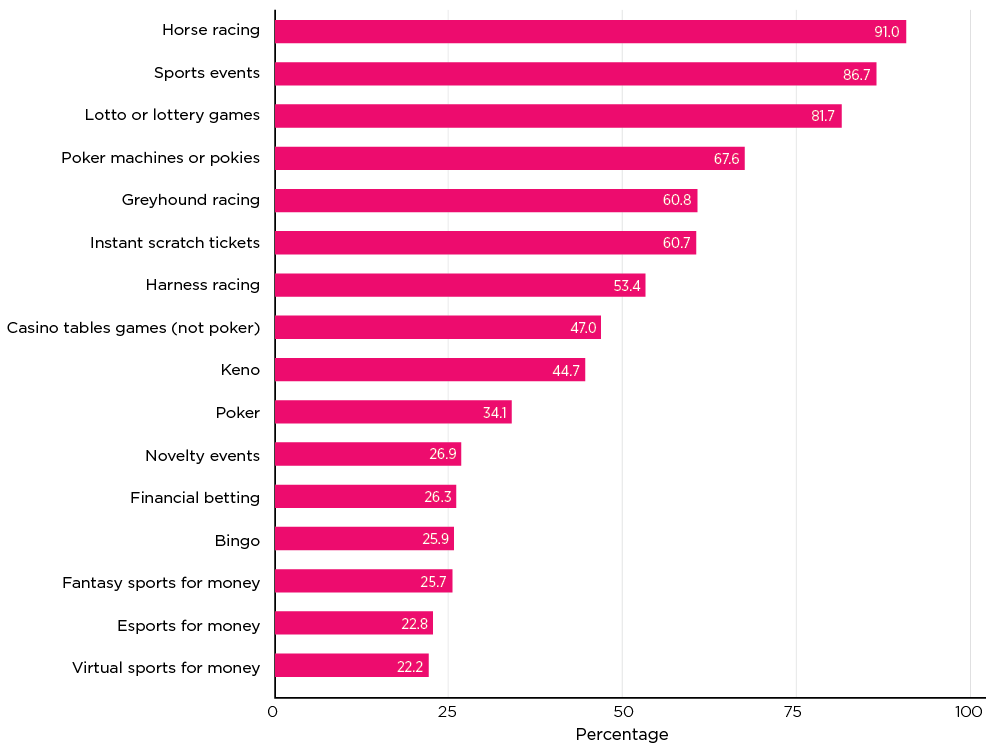
Note: Percentages do not add up to 100% as online bettors could gamble on one or more gambling activities in the past 12 months.
Gambling initiation
Around 2 out of 5 online bettors reported that their first experience of gambling with real money was on horse races (41.3%), while for around 1 in 6 it was sports events (16.3%), and 1 in 10 gambled on the pokies (12.7%).
Gambling participation by age and gender
Among regular online bettors, past year participation in gambling activities was proportionately higher for those in younger age groups (18-34 and 35-54 years) than the oldest age group (55+ years), with the exception of horse race betting, keno and lotto/lottery games. For example, betting on sports among regular online gamblers was most prevalent in the younger age groups (96.2% among those aged 18-34 years; 91.5% among those aged 35-54 years) than the oldest aged group (70.1% among those aged 55+ years). In contrast, betting on horse races was most prevalent in older age groups (96.0% aged 55+ years; 92.6% aged 35-54 years) than the youngest age group (84.0% aged 18-34 years).
Men were more likely than women to report gambling on greyhound racing (63.3% vs 56.2%) and harness racing (55.7% vs 48.6%). However, women were more likely than men to report participating in most other gambling activities including, for example, gambling on lotto/lottery games (90.5% vs 77.5%), gambling on the pokies (78.4% vs 62.2%) and gambling on casino table games (53.0% vs 43.8%).
Frequent gambling
More than half of regular online bettors reported betting on horse racing at least weekly (52.9%), and around half reported betting on sports (45.4%) (see Figure 2). Around one-third of regular online bettors reported gambling at least weekly on lotto/lottery games (36.3%), around one-quarter reported betting on greyhound racing (27.2%). On average, regular online bettors reported participating in 3 different types of gambling activities at least weekly.
Figure 2: At least weekly gambling participation by type of gambling activity
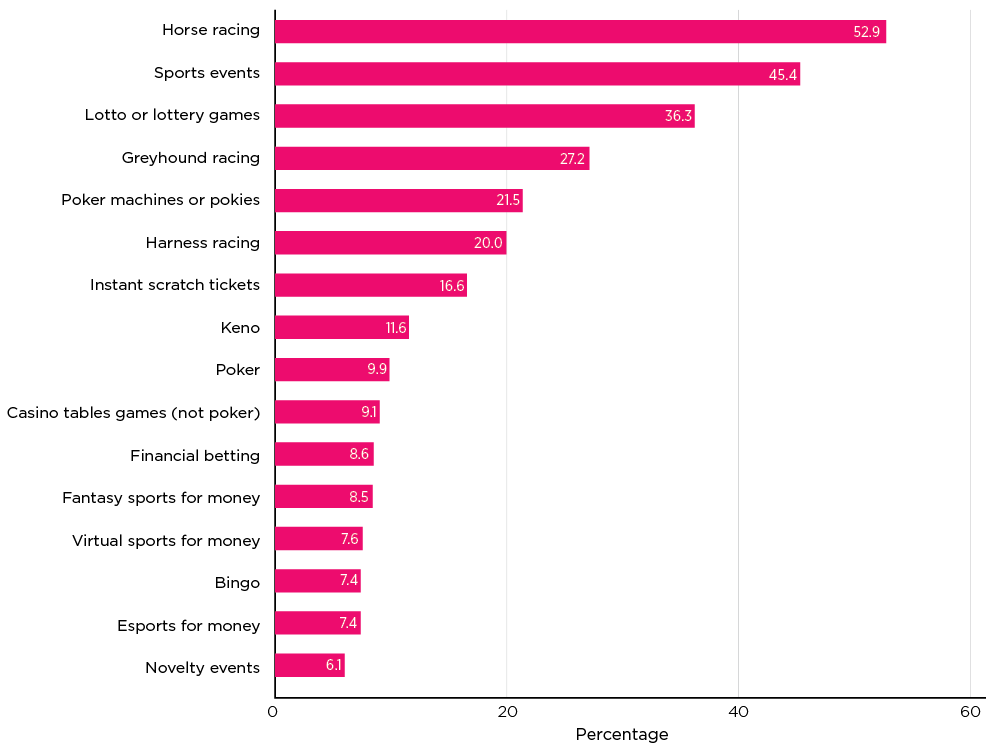
Note: Percentages do not add up to 100% as online bettors could gamble on one or more gambling activities at least weekly in the past 12 months.
Session length and time of day gambling
Participants were asked a range of questions focused on their most recent session of online gambling. The estimated median length of regular online bettors' most recent online betting session was 2.5 hours. Typically, online betting sessions were short at 10 minutes or less (17%), long at 12-24 hours (9.8%) or more than 24 hours (15.1%). However, session length varied considerably across participants (see Figure 3).
Figure 3: Length of most recent online betting session among regular online bettors
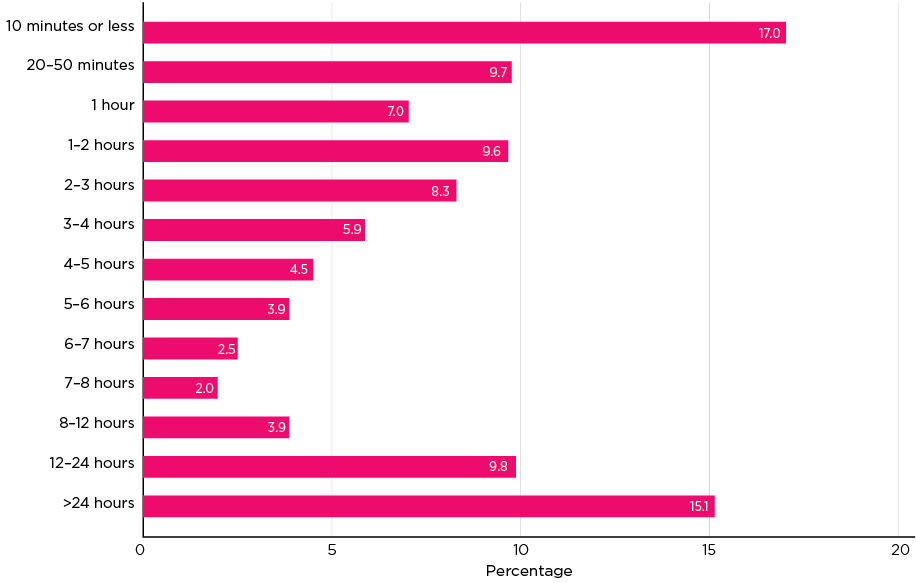
Notes: Sample n = 955. Data were missing for 0.8% of sample (n = 8).
Online gambling during both daytime and night-time hours was common. More than half of regular online bettors reported that their most recent online betting session was in the afternoon, either between midday and 3 pm (57.7%) or between 3 pm and 6 pm (60.3%) (see Figure 4). Around half reported that their most recent session was in the evening between 6 pm and 9 pm (49.2%). Large proportions also reported that their most recent session was in the morning between 10 am and midday (43.2%).
Figure 4: Times of day of most recent online betting session among regular online bettors

Notes: Sample n = 947. Data were missing for 0.8% of sample. Percentages do not add up to 100% as gambling could have occurred across multiple time of day categories.
Gambling expenditure and setting
Estimated monthly expenditure
The estimated expenditure on gambling across all gambling activities combined (excluding financial betting) by regular online bettors was $768 per month on average (median). However, estimated expenditure differed across gambling activities. For example, the highest estimated expenditure (per month median) was reported for gambling on horse races ($125), followed by gambling on sports events ($80), pokies ($50), lotto/lottery games ($40) and greyhound racing ($40) (see Figure 5).
Expenditure on gambling also differed by gender and age. For example, men reported higher estimated median monthly total expenditure on gambling compared to women ($982 vs $445), with the gender differences largest for betting expenditure on horse racing ($200 vs $60) and sports events ($100 vs $50).
Being younger was associated with higher median monthly expenditure, with expenditure on all gambling activities per month highest for participants aged 18-34 years ($886) and 35-54 years ($843) than those aged 55+ years ($623). Expenditure also varied by gambling activity; for example, younger groups had higher expenditure on sports betting ($125 per month), betting on horse racing ($80 per month), and gambling on the pokies ($80 per month). While being older (55+ years) was associated with higher median monthly expenditure for betting on horse racing ($200) and lotto/lottery games ($50).
Figure 5: Estimated expenditure (per month median) by regular online bettors on each type of gambling activity
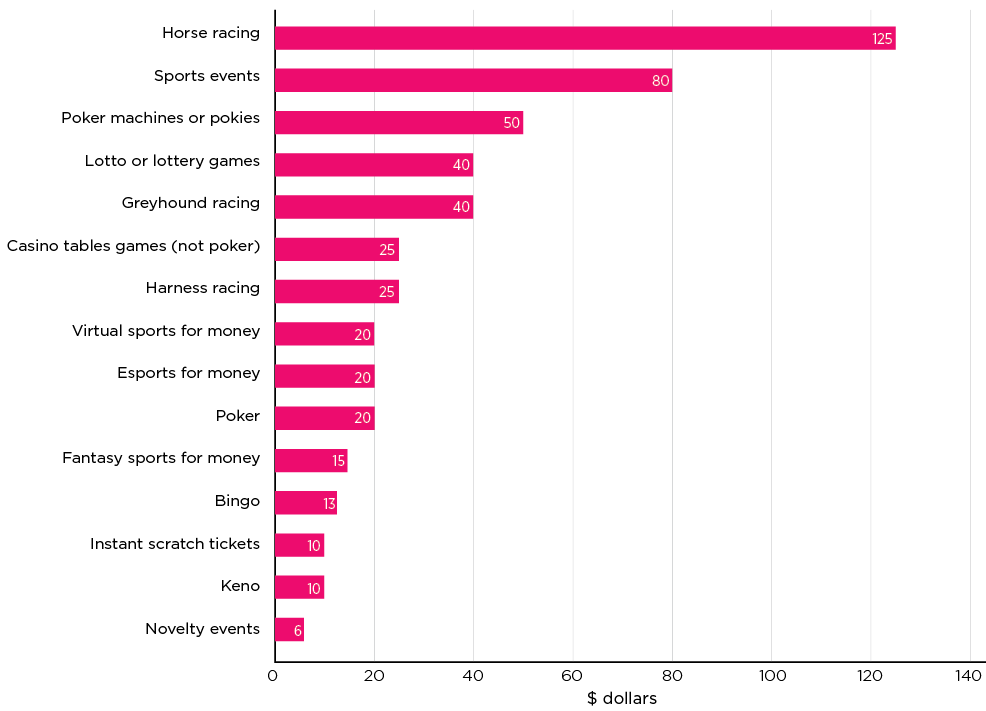
Notes: Monthly expenditure per activity was calculated using gambling frequency and reported expenditure on a typical day. The figure shows expenditure for 15 types of gambling activities (financial betting not included).
Payment methods
A variety of gambling payment methods were reported by regular online bettors for any type of gambling (see Figure 6). Non-credit payment methods were most commonly used, with around two-thirds (66.3%) using debit cards to pay for gambling, and around half (53.2%) using cash. However, more than a quarter of regular online bettors reported using credit cards to pay for gambling (26.7%).
Figure 6: Gambling payment methods used by regular online bettors in past 12 months
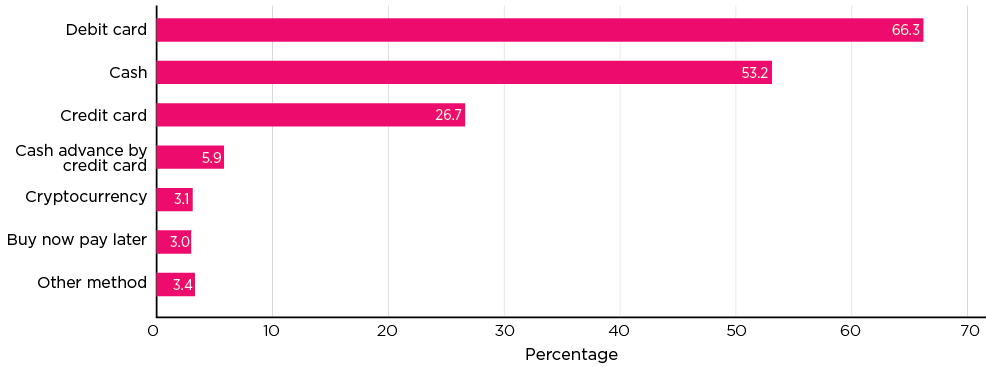
Note: Percentages do not add up to 100% as online bettors could have used multiple types of payment method for gambling.
Expenditure at most recent online betting session
The most common activities that regular online bettors reported betting on at their most recent session were horse racing (59.4%) and sports events (49%). Of those who reported betting on sports events, most bet on either AFL (36.5%), NRL 28.6%), soccer (17.5%) or cricket (10.5%), and more than a quarter reported betting on 2 or more sports (26.3%).
The average (median) total expenditure reported by regular online bettors at their most recent online betting session was $50. Around a quarter reported that they broke even at their most recent online betting session (23.2%), but larger proportions reported that they finished ahead (won money; 39%) or behind (lost money; 31.9%), with 5.9% unable to say.
More than two in five regular online bettors reported they did not set a maximum spending limit for their most recent online betting session (43%), and around one in five reported that they spent more than usual at their most recent session (18.8%).
Of those regular online bettors who did set a maximum spend/time limit for their most recent session (53.1%), both informal and formal limits were used, including: making a mental note to spend up to a set amount (69.4%), setting themselves maximum spend limits via their account or machine (33.1%), or by setting a maximum spend limit via their personal bank/cash app (6.9%). Of those who set a maximum spend limit, the median limit set was $50.
Betting locations and modes
The most common location where regular online bettors reported betting on sports or races in the past year was at home (84.5%). Around a third of regular online bettors also reported betting on sports or races at licensed venues (33.4%), and around 1 in 5 reported betting on sports or races at the house of a friend/family member (21.3%), at a sporting event or racetrack or at a TAB/UBET agency/shop (19.9% each), at work (14.8%) or at a casino (14.3%).
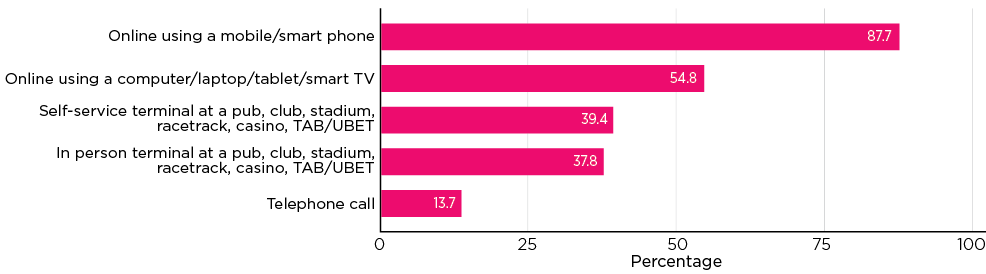
The majority of regular online bettors reported that they used a mobile phone to bet online on sports or races (87.7%), and more than half reported using a computer/laptop/tablet/smart TV (54.8%) (see Figure 7). More than a third reported betting using a self-service terminal at a venue (39.4%) or betting in-person at a venue (37.8%).
Figure 7: Locations/modes of online betting used by regular online bettors in the past 12 months
Betting alone or with others
Close to two-thirds of regular online bettors reported gambling on their own at their most recent online betting session (63.0%). However, close to a quarter reported betting online while being with a spouse/partner (23.7%), and around one in ten with friends/colleagues (11.2%).
Men were more likely to report betting alone at their most recent online betting session (71.8%) compared to women (46.4%), while women were more likely to report betting with their spouse/partner (37.1%) or a family member/relative (12.7%) than men (16.6% and 6.8%) (see Figure 8).
Younger online bettors (aged 18-34 years) were more likely to report being with friends/colleagues at their most recent online betting session (19.2%) compared to older age groups (7.9% of those aged 35-54 years; 7.6% of those aged 55+ years). Older online bettors (aged 55+ years) were more likely to report being by themselves at their most recent online betting session (69.8%) compared to those aged 18-34 years (53%) or aged 35-54 years (65.6%).
Figure 8: Others present (by gender) with regular online bettors during their most recent online betting session
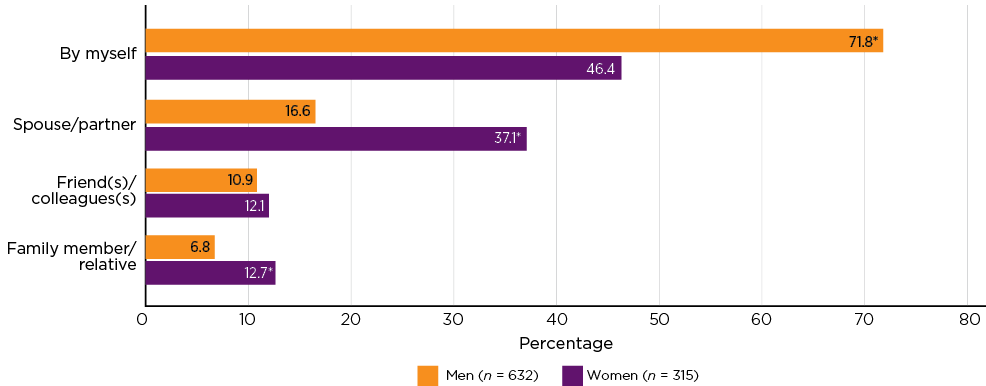
Notes: *Significantly different at p < .05 level. Those who identify with 'non-binary' were excluded from the analysis due to the small sample size.
Legal and illegal online gambling accounts
While around 4 in 10 regular online bettors reported having only 1 online betting account (41.3%), more than half reported having multiple accounts (55.1%). More than a quarter of regular online bettors reported having 3 or more online betting accounts (28.7%).
More than 1 in 10 (13.3%) regular online bettors reported gambling in the past year with an online betting account that they believed was an offshore (illegal) online betting service. Gambling with an offshore (illegal) online betting service was more likely to be reported by males (16.3%) than females (6.4%).
Although a majority (68.7%) of regular online bettors reported not using an offshore (illegal) online betting service, around one-fifth (18.0%) reported being unsure if the online account/s they had used were operated by offshore (illegal) online betting services providers.
At-risk gambling and experiences of gambling-related harm
Prevalence of at-risk gambling
Among Australian adults who bet regularly online on sports or races, more than two-thirds (68.4%) met the criteria for at-risk gambling (low-risk, moderate-risk and high-risk/'problem' gambling combined), based on Ferris and Wynne's (2001) Problem Gambling Severity Index (PGSI; see Figure 9). More than a quarter (29.3%) met the criteria for high-risk gambling.
Figure 9: Classification of Australian adults who bet regularly online on sports or races according to the Problem Gambling Severity Index (PGSI)
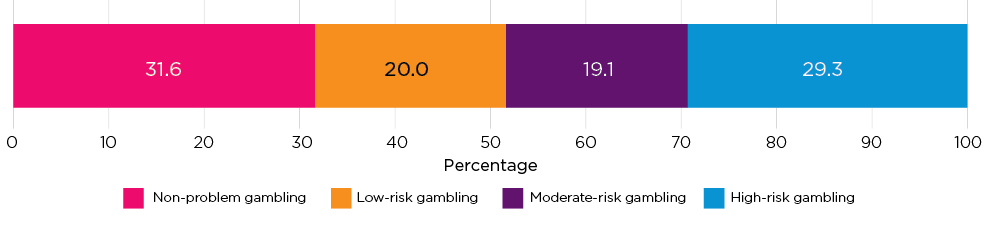
Notes: At-risk gambling during the past 12 months was assessed using the 9-item Problem Gambling Severity Index (PGSI; Ferris & Wynne, 2001). Respondents were grouped into 4 categories based on their scores: non-problem gambling (0), low-risk gambling (1-2), moderate-risk gambling (3-7) and high-risk/'problem' gambling (8-27). Respondents scoring 1+ may be classified as being at some risk of, or already experiencing, gambling problems.
Gender, age and gambling frequency differences in at-risk gambling
Although all age groups had high levels of at-risk gambling, there was a higher prevalence of at-risk gambling among younger regular online bettors (aged 18-34 years), with more than four in five of this age group classified as at-risk (81.9%) compared to those aged 35-54 years (67.9%) or 55+ years (55.0%) (see Figure 10). For men and women the prevalence of at-risk gambling was similar (67.9% and 68.9%, respectively), but for weekly online bettors the prevalence of at-risk gambling was higher than it was for fortnightly online bettors (70.2% compared to 62.7%, respectively).
Figure 10: Age, gender and gambling frequency of regular online bettors by at-risk gambling status
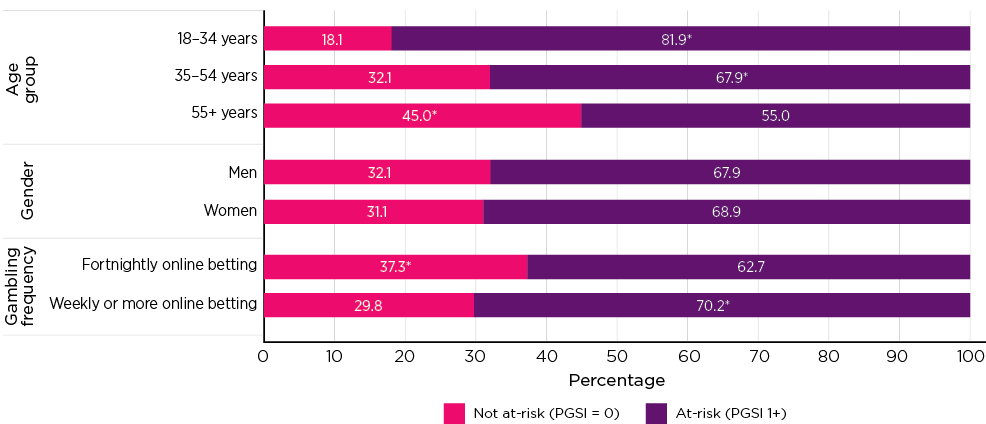
Notes: Respondents scoring 1+ on the PGSI are classified as being at some risk of, or already experiencing, gambling harm; respondents scoring 0 on the PGSI are classified as not at-risk of gambling harm. Those who identify with 'non-binary' were excluded from the analysis due to the small sample size. *Significantly different at p < .05 level.
Differences in gambling behaviours for at-risk online bettors
The intensity of gambling behaviours of online bettors at-risk of gambling harm (PGSI = 1+) were higher than those not at-risk (PGSI = 0; see Table 2 and Table 4 Dashboard), as shown by:
- higher frequency gambling (at least weekly) on all gambling activities, excluding horse racing and lotto/lottery games
- higher total weekly expenditure on all gambling activities (median $150 at-risk; $50 not at-risk)
- higher estimated monthly expenditure gambling on sports events and pokies
- having on average a higher number of online betting accounts, and more likely to use an illegal offshore online betting account and engage in online in-play betting on sport
- having, in their most recent online sports/race betting session: higher total expenditure, longer session length, higher number of bets placed, gambled in early hours (midnight-8am), gambling with friends/colleagues, bet on impulse, consumed alcohol, been affected by illicit drugs, experienced financial problems as a result.
| Gambling behaviours | Not at-risk online bettors (n = 302) | At-risk online bettors (n = 653) |
|---|---|---|
| Estimated monthly expenditure (median AUD$) | ||
| Horse racing | $110 | $125 |
| Sports events | $50 | $100* |
| Poker machines or pokies | $15 | $88* |
| Lotto or lottery games | $32 | $40 |
| Greyhound racing | $13 | $40 |
| Casino table games (not poker) | $13 | $29 |
| Poker | $13 | $25 |
| Harness racing | $11 | $25 |
| Instant scratch tickets | $8 | $13 |
| Keno | $6 | $13 |
| Underage gambling (<18 years) | ||
| First gambled with money underage | 16.9% | 21.7% |
| First gambled at least fortnightly while underage | 7.0% | 7.2% |
| Last online sports/race betting session | ||
| Total expenditure (median AUD$) | $30 | $50* |
| Mean number of bets placed | 5.6 | 8.5* |
| Session length (median minutes) | 150 | 270* |
| Gambled online between: | ||
| midnight and 4 am | 16.6% | 31.4%* |
| 4 am and 7 am | 15.6% | 29.9%* |
| 7 am and 10 am | 21.9% | 34.6%* |
| 10 am and midday | 37.4% | 45.9%* |
| midday and 3 pm | 53.0% | 59.9%* |
| 3 pm and 6 pm | 55.0% | 62.8%* |
| 6 pm and 9 pm | 36.4% | 55.1%* |
| 9 pm and midnight | 20.9% | 40.0%* |
| Midnight and 8 am | 19.2% | 33.5%* |
| Gambled alone | 63.9% | 62.6% |
| Gambled with spouse/partner | 27.5% | 21.9% |
| Gambled with friends/colleagues | 7.9% | 12.7%* |
| Percentage of bets planned in advance (mean) | 65.9%* | 50.0% |
| Percentage of bets on impulse before start of event (mean) | 28.0% | 36.0%* |
| Percentages of bets on impulse during the event (mean) | 6.1% | 14.1%* |
| Consumed alcohol (before, while, or after session) | 29.1% | 41.5%* |
| Smoked cigarettes/tobacco or vaped nicotine | 18.5% | 38.3%* |
| Affected by illicit drugs | 2.0% | 6.6%* |
| Session resulted in experiencing financial problems | 0.0% | 11.5%* |
| Set a spend and/or time limit | 52.3% | 53.4% |
| Spend limit set (median AUD$) | $50 | $100* |
Notes: Respondents scoring 1+ on the PGSI are classified as being at some risk of, or already experiencing, gambling harm; respondents scoring 0 on the PGSI are classified as not at-risk of gambling harm. *Significantly different at p < .05 level between not at-risk and at-risk online bettors.
Experiences of gambling-related harms
More than half (52.2%) of regular online bettors reported experiencing at least one of ten potential gambling-related harms in the past year, based on the Short Gambling Harms Screen (SGHS; see Table 3). The most prevalent gambling harms reported were a reduction in available spending money, a reduction in savings and having regrets about gambling.
The likelihood of experiencing at least one gambling-related harm in the past year was very high among those online bettors classified as being at-risk of gambling harm (70.2%). Notably, more than one in seven not at-risk online bettors (13.6%) reported experiencing at least one gambling-related harm in the past year.
| Type of gambling-related harm experienced | Total online bettors (N = 955) % | Not at-risk online bettors (n = 302) % | At-risk online bettors (n = 653) % |
|---|---|---|---|
| A reduction in your available spending money | 34.8 | 6.3 | 47.9* |
| A reduction in your savings | 32.3 | 5.6 | 44.6* |
| Had regrets that made you feel sorry about your gambling | 28.0 | 2.3 | 39.8* |
| Had less spending on recreational expenses such as eating out, going to movies or other entertainment | 29.6 | 3.3 | 41.8* |
| Felt ashamed of your gambling | 23.7 | 0.3 | 34.5* |
| Spent less time with people you care about | 23.6 | 3.3 | 32.9* |
| Felt distressed about your gambling | 22.0 | 0.7 | 31.9* |
| Felt like a failure | 21.8 | 1.0 | 31.4* |
| Increased card debt | 14.6 | 2.0 | 20.4* |
| Sold personal items | 12.3 | 0.0 | 17.9* |
| Experienced one or more harms (out of ten) | 52.2 | 13.6 | 70.2* |
Notes: Experience of gambling harms was measured using the Short Gambling Harms Screen (SGHS) which is 10-item assessment of individuals' experience of harms caused by gambling (Browne, Goodwin, & Rockloff, 2018). Respondents scoring 1+ on the PGSI are classified as being at some risk of, or already experiencing, gambling harm; respondents scoring 0 on the PGSI are classified as not at-risk of gambling harm. *Significantly different at p < .05 level between not at-risk and at-risk online bettors.
Help seeking and use of harm minimisation tools
Help seeking by online bettors
There was a low rate of help-seeking for gambling related problems among regular online bettors. Only around one in twenty (6.3%) reported that they had sought help. Most (80.0%) reported that they didn't need help. However, around one in ten (10.6%) reported that they wanted to seek help but had not done so. The most common reason those individuals reported for not seeking help was feeling embarrassed (46.5%). Some also reported that they didn't think the currently available help would change their gambling (23.8%).
Online bettors at-risk of gambling harm (PGSI = 1+) were more likely to seek help for their gambling (9.0% vs 0.3% not at-risk online bettors) or want to seek help (15.2% vs 0.7% not at-risk).
Among those who did seek help, financial problems were the most reported reason for doing so, followed by relationship problems, health problems and work/study problems (see Figure 11).
Figure 11: Reasons for seeking help for gambling in the past 12 months reported by regular online bettors
Note: Based on a sample of regular online bettors who sought help (n = 60).
The main types of help that were sought by regular online bettors included:
- enrolling in a self-exclusion program (30%)
- calling a helpline (e.g. Gambler's Help, Lifeline) (28.3%)
- seeking help from a community organisation (e.g. sporting club, church group, charity organisation) (26.7%)
- seeking help from a doctor, psychologist or counsellor (25%)
- browsing a gambling help-related website or forum (20%).
Consumer protection tools and other actions used by online bettors
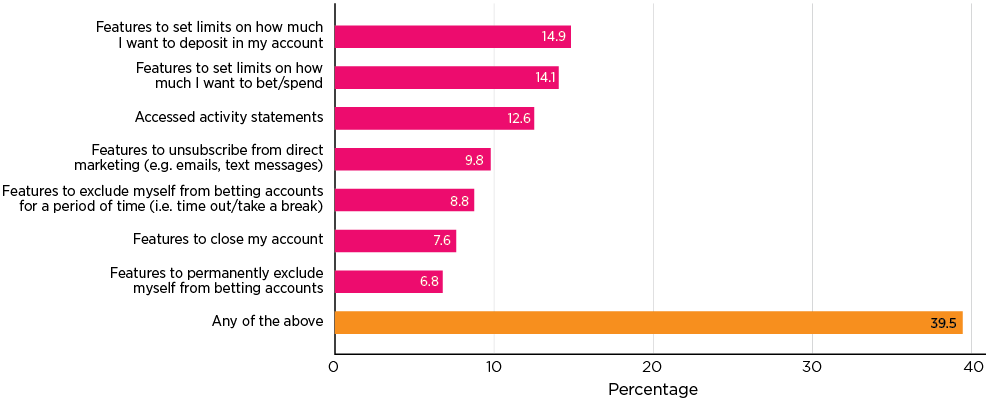
Four in 10 regular online bettors (39.5%) reported using any online sports/race betting app- or web-based consumer protection tools in the past 12 months to limit the amount of time or money they spent betting (see Figure 12). The most common harm minimisation tools that regular online bettors reported using were setting a maximum deposit limit on their online betting account (14.9%), using account features to set limits on betting/spending (14.1%) and accessing their betting activity statements (12.6%).
Figure 12: Consumer protection tools (app or website) used in past 12 months by regular online bettors to try and control the amount of money or time spent betting on sports/races

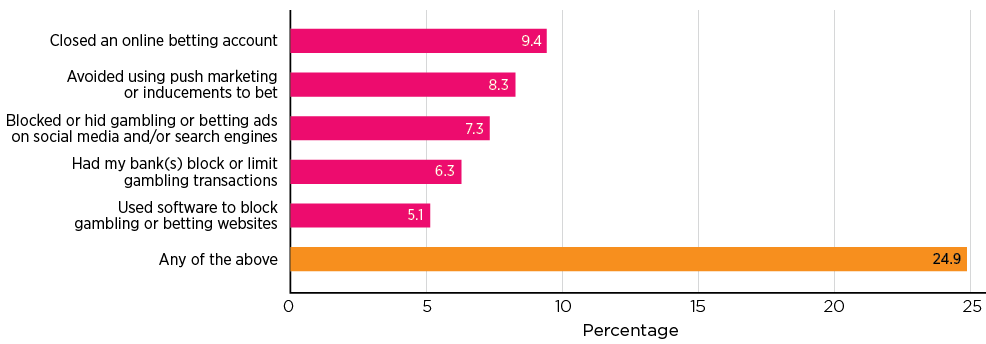
Only around one-quarter of regular online bettors (24.9%) reported taking any actions in the past year to limit the amount of time or money spent betting online (see Figure 13). Closing an online betting account was the most reported action (9.4%), followed by avoiding push marketing and inducements to bet (8.3%) and blocking gambling advertising on social media and internet search engines (7.3%).
Figure 13: Harm minimisation action taken in past 12 months by regular online bettors to try and control the amount of money or time spent betting online
Health and wellbeing
Alcohol use
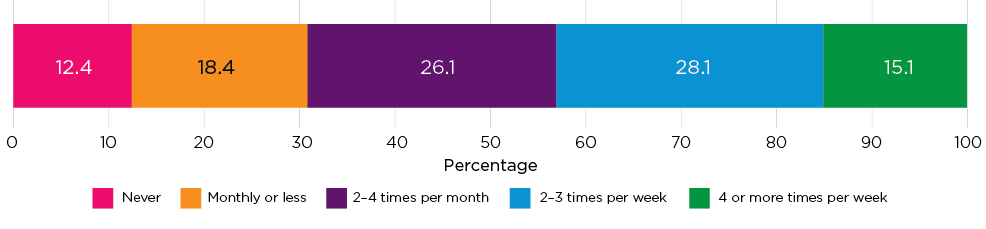
There was a high prevalence of alcohol use among regular online bettors, with around four in five (87.6%) reporting past year alcohol use (see Figure 14). More than one-quarter (28.1%) reported drinking 2 to 3 times a week, and around one in six (15.1%) reported drinking 4 or more times a week. Based on the Alcohol Use Disorders Identification Test-Concise (AUDIT-C), more than half (62.9%) of regular online bettors were high-risk hazardous drinkers, and the average expenditure (mean) on alcohol in a typical week (reported by 45.0% of past-year drinkers) was $88.50.
Online bettors at-risk of gambling harm (PGSI = 1+) were more likely to than those not at-risk of gambling harm (PGSI = 0) to: have drunk alcohol in the past 12 months, be classified as a high-risk hazardous drinker, and spend more on alcohol in a typical week (see Table 4 Dashboard).
Figure 14: Frequency of alcohol use in the past year among regular online bettors
Note: Percentages in chart do not add up to 100% as numbers shown are rounded to 1 decimal place.
Past-year drinkers were asked about alcohol use surrounding their most recent online betting session (i.e. before, during, and/or after betting). Of drinkers, around 2 in 5 (42.9%) reported consuming alcohol proximate to their most recent online betting session, with around one-quarter reporting that they were drinking while betting (25.8%). Of those consuming alcohol surrounding their most recent online betting session, 1 in 5 (18.1%) reported consuming 2 standard drinks, and around one in seven (13.1%) reported consuming 3 standard drinks (median total drinks = 4). Around 1 in 10 reported consuming 6 or more standard drinks during their last online session (10.9%).
Smoking
Almost one-third (30.3%) of regular online bettors reported that they were smokers (had smoked in the past year), and around 1 in 5 (19.3%) reported using electronic cigarettes or vaporising devices to inhale nicotine.
Smokers were asked about smoking on the day of their most recent online betting session. More than three-quarters of smokers reported that they had smoked that day (81.7%). Around two-thirds reported smoking cigarettes or other tobacco (65.2%), and around one-third reported vaping nicotine (33.3%).
Online bettors at-risk of gambling harm (PGSI = 1+) were more likely than those not at-risk of gambling harm (PGSI = 0) to: smoke cigarettes or other forms of tobacco, use e-cigarettes or vapes to inhale nicotine, and smoke either around their last online betting session (see Table 4 Dashboard).
Mental illness
Probable serious mental illness was identified in 4.0% of regular online bettors, based on the Kessler Psychological Distress Scale (K6). During the past 30 days, around two-thirds of regular online bettors said they felt nervous (68.1%), felt that everything was an effort (64.7%) or felt restless and fidgety (64.0%), at least a little of the time or more often.
Online bettors at-risk of gambling harm (PGSI = 1+) were more likely to than those not at-risk of gambling harm (PGSI = 0) to meet criteria for probable serious mental illness (5.5% compared to 0.7%).
Dashboard: National gambling trends - regular online bettors
The following dashboard of national gambling trends presents key indicators of gambling participation, risks of harm and harm minimisation behaviour among regular online bettors in Australia (see Table 4). The 2022 figures presented in this inaugural dashboard represent baseline values that will be compared over time in future annual releases of the NGTS.
| Gambling participation | Total online bettors (N = 955) % | Not at-risk online bettors (n = 302) % | At-risk online bettors (n = 653) % |
|---|---|---|---|
| High frequency gambling activities (at least weekly) | |||
| Horse racing | 52.9 | 53.0 | 52.8 |
| Sports events | 45.4 | 37.4 | 49.2* |
| Lotto or lottery games | 36.3 | 37.7 | 35.7 |
| Greyhound racing | 27.2 | 15.2 | 32.8* |
| Poker machines or pokies | 21.5 | 7.9 | 27.7* |
| Harness racing | 20.0 | 10.9 | 24.2* |
| Instant scratch tickets | 16.6 | 11.9 | 18.8* |
| Keno | 11.6 | 6.0 | 14.2* |
| Poker | 9.9 | 3.0 | 13.2* |
| Casino table games | 9.1 | 2.6 | 12.1* |
| Expenditure on gambling | |||
| Total gambling expenditure (all activities) in a typical week (median AUD$) | $100 | $50 | $150* |
| Estimated monthly gambling expenditure (median AUD$) | $768 | $352 | $1,011* |
| Payment methods for gambling | |||
| Cash | 53.2 | 45.0 | 57.0* |
| Debit card | 66.3 | 58.3 | 70.0* |
| Credit card | 26.7 | 21.9 | 28.9* |
| Cash advance by credit card | 5.9 | 2.0 | 7.7* |
| Buy now pay later | 3.0 | 0.3 | 4.3* |
| Cryptocurrency | 3.1 | 0.7 | 4.3* |
| Location bet on sports/races | |||
| At home | 84.5 | 92.1* | 81.0 |
| At a licenced venue | 33.4 | 28.5 | 35.7* |
| At a friend's/ family member's home | 21.3 | 14.9 | 24.2* |
| At a sporting event or racetrack | 19.9 | 16.6 | 21.4 |
| At a TAB/UBET agency/shop | 19.9 | 15.9 | 21.7* |
| At work | 14.8 | 9.3 | 17.3* |
| At a casino | 14.3 | 8.9 | 16.8* |
| While commuting | 5.8 | 3.3 | 6.9* |
| At school/university/TAFE | 3.6 | 1.0 | 4.7* |
| Online betting accounts | |||
| Have active online betting account/s | 96.3 | 98.3 | 95.4 |
| Mean number of online betting accounts | 3.0 | 2.3 | 3.4* |
Online betting accounts that are offshore (illegal) Yes No Unsure |
68.7 18.0 |
75.1* 15.2 |
65.7 19.4 |
| Illegal online gambling activities | |||
| Online in-play betting on sport | 18.1 | 8.9 | 22.4* |
| Online pokies (slots) | 17.4 | 7.3 | 22.1* |
| Online casino-style games | 12.5 | 6.6 | 15.2* |
| Risk of harm | Total online bettors (N = 955) % | Not at-risk online bettors (n = 302) % | At-risk online bettors (n = 653) % |
|---|---|---|---|
| Problem Gambling Severity Index (PGSI) | |||
| At-risk gambling (PGSI≥1) | 68.4 | 0.0 | 100.0 |
| Non-problem gambling (0) | 31.6 | 100.0 | 0.0 |
| Low-risk gambling (1-2) | 20.0 | 0.0 | 100.0 |
| Moderate-risk gambling (3-7) | 19.1 | 0.0 | 100.0 |
| Problem gambling (8-27) | 29.3 | 0.0 | 100.0 |
| Mean score (out of 0-27) | 5.12 | 0.00 | 7.49 |
| Short Gambling Harm Screen (SGHS) | |||
| 1 or more harms | 52.2 | 13.6 | 70.2* |
| Mean score (out of 0-10) | 2.42 | 0.25 | 3.44* |
| Alcohol and other drug use | |||
| Any alcohol use (past 12 months) | 87.6 | 84.1 | 89.3* |
| At least weekly alcohol use | 54.1 | 58.3 | 58.2 |
| High-risk hazardous drinker (AUDIT-C) | 62.9 | 53.0 | 67.5* |
| Mean weekly spend on alcohol (AUD$) | $88.5 | $65 | $99* |
| Smoke cigarettes/tobacco (past 12 months) | 30.3 | 16.9 | 36.4* |
| E-cigarette/vape use (past 12 months) | 19.3 | 7.6 | 24.7* |
| Harm minimisation | Total online bettors gamblers (N = 955) % | Not at-risk online bettors (n = 302) % | At-risk online bettors (n = 832) % |
|---|---|---|---|
| Help-seeking | |||
| Sought help in past 12 months | 6.3 | 0.3 | 9.0* |
| Wanted to seek help but didn't | 10.6 | 0.7 | 15.2* |
| Actions taken to control money/time spent gambling at a venue | |||
| Set deposit limit | 14.9 | 8.9 | 17.6* |
| Set a bet/spend limit | 14.1 | 7.9 | 17.0* |
| Accessed activity statements | 12.6 | 6.6 | 15.3* |
| Unsubscribed from direct marketing | 9.8 | 3.6 | 12.7* |
| Temporarily self-excluded | 8.8 | 0.7 | 12.6* |
| Closed online betting account | 7.6 | 1.0 | 10.7* |
| Permanently self-excluded | 6.8 | 0.7 | 9.6* |
| Any of the above | 39.5 | 18.9 | 49.0* |
Notes: Total sample of respondents who gambled regularly online on sports and/or races (at least fortnightly) in past 3 months = 995. Estimated monthly gambling expenditure calculated for 15 gambling activities, excluding financial betting. PGSI: Problem Gambling Severity Index (Ferris & Wynne, 2001). Not at-risk gambling (PGSI score = 0); at-risk gambling (PGSI score = 1+). SGHS: Short Gambling Harm Screen (Browne, Goodwin, & Rockloff, 2018). AUDIT-C: Alcohol Use Disorders Identification Test-Concise (World Health Organization, 2001). *Significantly different at p < .05 level between not at-risk and at-risk online bettors.
References
Browne, M., Goodwin, B. C., & Rockloff. M. J. (2018). Validation of the Short Gambling Harm Screen (SGHS): A tool for assessment of harms from gambling. Journal of Gambling Studies, 34(2), 499-512. doi: 10.1007/s10899-017-9698-y
Ferris, J., & Wynne, H. (2001). The Canadian Problem Gambling Index: Final report. Submitted for the Canadian Centre on Substance Abuse (CCSA). Ottawa: Canadian Centre on Substance Abuse. Retrieved from jogoremoto.pt/docs/extra/TECb6h.pdf
Hing, N., Russell, A. M. T., Browne. M., Rockloff, M., Greer, N., Rawat, V. et al. (2021). The second national study of interactive gambling in Australia (2019-20). Melbourne: Gambling Research Australia. Retrieved from www.gamblingresearch.org.au/sites/default/files/2021-10/Interactive%20Gambling%20Study.pdf
World Health Organization (WHO). (2001). AUDIT: The Alcohol Use Disorders Identification Test. Guidelines for use in primary health care. Geneva: WHO. Retrieved from www.who.int/publications/i/item/WHO-MSD-MSB-01.6a
Media releases
Contributions and acknowledgements
This research was conducted by the Australian Gambling Research Centre (AGRC) team at the Australian Institute of Family Studies: Dr Rebecca Jenkinson, Dr Nancy Greer, Dr Brian Vandenberg, Dr Kei Sakata, Uma Jatkar and Cailem Murray Boyle.
Featured image: © GettyImages/cyano66
Suggested citation
Greer, N., Jenkinson, R., Vandenberg, B., & Sakata, K. (2023). Regular online betting in Australia, 2022: National Gambling Trends Study. Melbourne: Australian Gambling Research Centre, Australian Institute of Family Studies.
978-1-76016-299-3
Download Research snapshot
Related publications

Regular pokies gambling in Australia, 2022
This research summary presents findings from a 2022 survey of Australian adults who gambled on pokies on a regular…
Read more
Consumer views on emerging trends and future directions for…
This research summary presents findings from the 2022 National Gambling Trends Study surveys of Australian adults who…
Read more